

Derek Sollberger @dsollberger@qoto.org
data science person at UC Merced, data analyst, cartographer, budding sabremetrician
http://dsollberger.com
Joined Oct 2022
Granted, I didn't do much R programming before the tidyverse, but nevertheless here is a quick meme
With the goal of learning my students’ names and faces faster, I wrote an R script that will convert a roster (“People” in a Canvas course) to a gt table for later customization
code (R, #gt, #rvest): https://dsollbergerquarto.netlify.app/posts/canvas_r
My students have been asking for simultaneous collaborative coding for years :-)
Derek Sollberger
boosted

I am happy to share that our manuscript “Framework for Accessible and Inclusive Teaching Materials for Statistics and Data Science Courses” has been accepted for publication in Journal of Statistics and Data Science Education.
w/ Alicia Johnson and @Miles_Ott
This manuscript includes our guiding principles of writing the Bayes Rules book.
https://www.tandfonline.com/doi/full/10.1080/26939169.2023.2165988
Spending the past 3 hours wrestling with Python dependencies makes me appreciate the tidyverse
Derek Sollberger
boosted

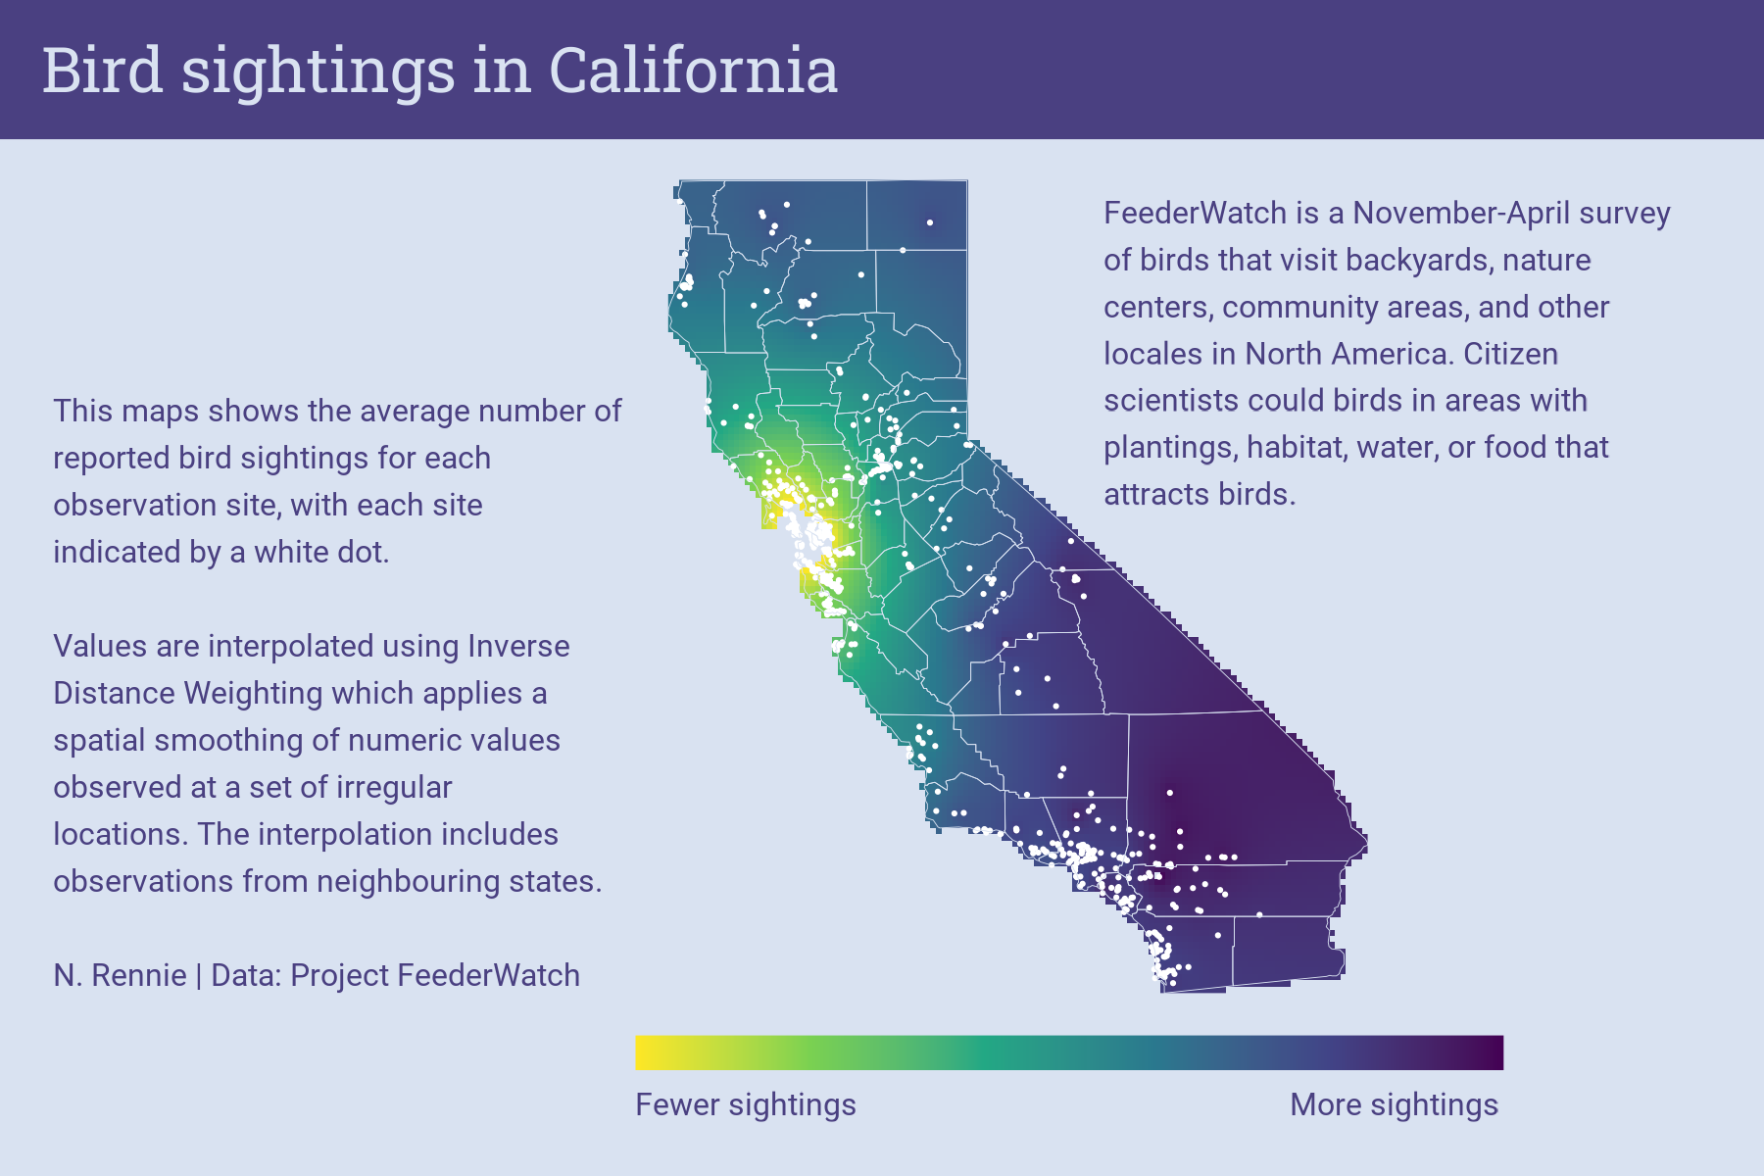
This week's #TidyTuesday data is from Feederwatch, a survey of North America from Nov-Apr, counting birds that visit community areas🐦Styling is similar to last week's map since I spent a bit more time on data wrangling and modelling!
Code: https://github.com/nrennie/tidytuesday/tree/main/2023/2023-01-10
Counties in the continental United States whose names are of Native American origin
#MapPromptMonday (theme: heatmap)
R code and notes: https://github.com/dsollberger/mappromtmonday/blob/main/20230109.qmd
image alt text: The states with a decent representation of counties whose names are of Native American origin include New York, Michigan, Arizona, and the western states. There is a surprising lack (in my opinion) in Texas, Tennessee, Montana, Wyoming, and the Dakotas.
Due to the size and proximity of the highlighted counties, the heatmap emphasizes regions between and including New York to Michigan, along with Mississippi.
TL;DR: seeking advice on how to setup Jupyter and LearnR side-by-side to maybe write a decent paper later
This semester, my department is piloting a university-wide Jupyter Lab (later: for all of our data science courses). I have been using LearnR for the past few semesters, and I hope to compare student experience with both platforms during this upcoming semester. So far, I am thinking:
* assign Jupyter to half of the students, assign LearnR to half of the students
* both will be in the R programming language
both will have the same homework exercises
* note: LearnR by default gives users guidance/hints, and I have been using gradethis for automatic grading. I haven't started up with nbgrader for Jupyter yet.
How does this setup look? What advice do you have?
TIL that $\sqrt(5)$ has its own Wikipedia page
I was learning some sports data viz, and then I quickly adapted the following image of basketball shot data for my first foray into #MapPromptMonday (theme: "regions")
image alt text: ggplot of a half of a basketball court. The data is about player Kevin Durant, from the 2016 to 2017 season, and is grouped by "shot type": dunk, lay up, or shot.
The dunks took place very close to the basket, while lay ups happened in a range that was still close to the basket, but not necessarily as close as dunks.
For the rest of the shots, they are spread out, but with an obvious arc where the three-point shot opportunities are.
Surprisingly, some of the shots are credited to locations slightly out-of-bounds.
I sat here for about 5 minutes wondering why a LaTeX file wasn't loading
and then I remembered that I hadn't added any content yet
enjoyed Tim Hopper's shout out to "programmed in TI-BASIC" at #normconf
TIL that in LaTeX one can simply put all \usepackage{...} and other preamble customization in a separate file, and then load that file elsewhere!
* just read the chapter about memes
* can now give a seminar on the History of Memes
* just to be "Ok, boomer'ed" by the audience
In RStudio, TIL `reformat code`
CTRL-SHIFT-A
solved Day 21 of #AdventofCode "Monkey Math" (Part 1 anyway) by using the `eval` function for the first time, lol
R code: https://github.com/dsollberger/adventofcode/blob/main/2022/20221221.qmd
"120 FPS living in a 60 FPS world"
---Lawrence Sonntag's chat
(rambling) I'm concerned that students will turn in AI-generated code that includes depreciated functions in R
hmm, I need to update the "Software Instructions" for my data science courses
data science person at UC Merced, data analyst, cartographer, budding sabremetrician
http://dsollberger.com
Joined Oct 2022
