
martinwaring @martinwaring@qoto.org
- Country
- United Kingdom
Stats lover from South West England, now North beyond the wall.
Well, my first attempt at a #MakeOverMonday as I continue to learn/play #Tableau
Current thoughts, compared to #QlikView, I like Tableau's simplicity to create a simple visualisation and the Story elements look cool, but need to figure out (learn) calculated fields and its version of Set Analysis.
Also, feels less free than QlikView, but that is probably a lack of knowledge on my part.
Greetings, Mastadonians. I’m #NewHere and apparently it’s a good idea to post an #introduction. I’m Ally, a queer disabled musician, book worm, sci-fi nerd, classic film buff and pun enthusiast. Feel free to point me towards the likeminded nerds.
(And also feel free to check out my music on Bandcamp, the link is in my profile. Recommended if you like Ivor Cutler, Robert Wyatt, Slint, Papa M, Kraftwerk, Gary Numan, and lyrics about long-dead Hollywood stars.)

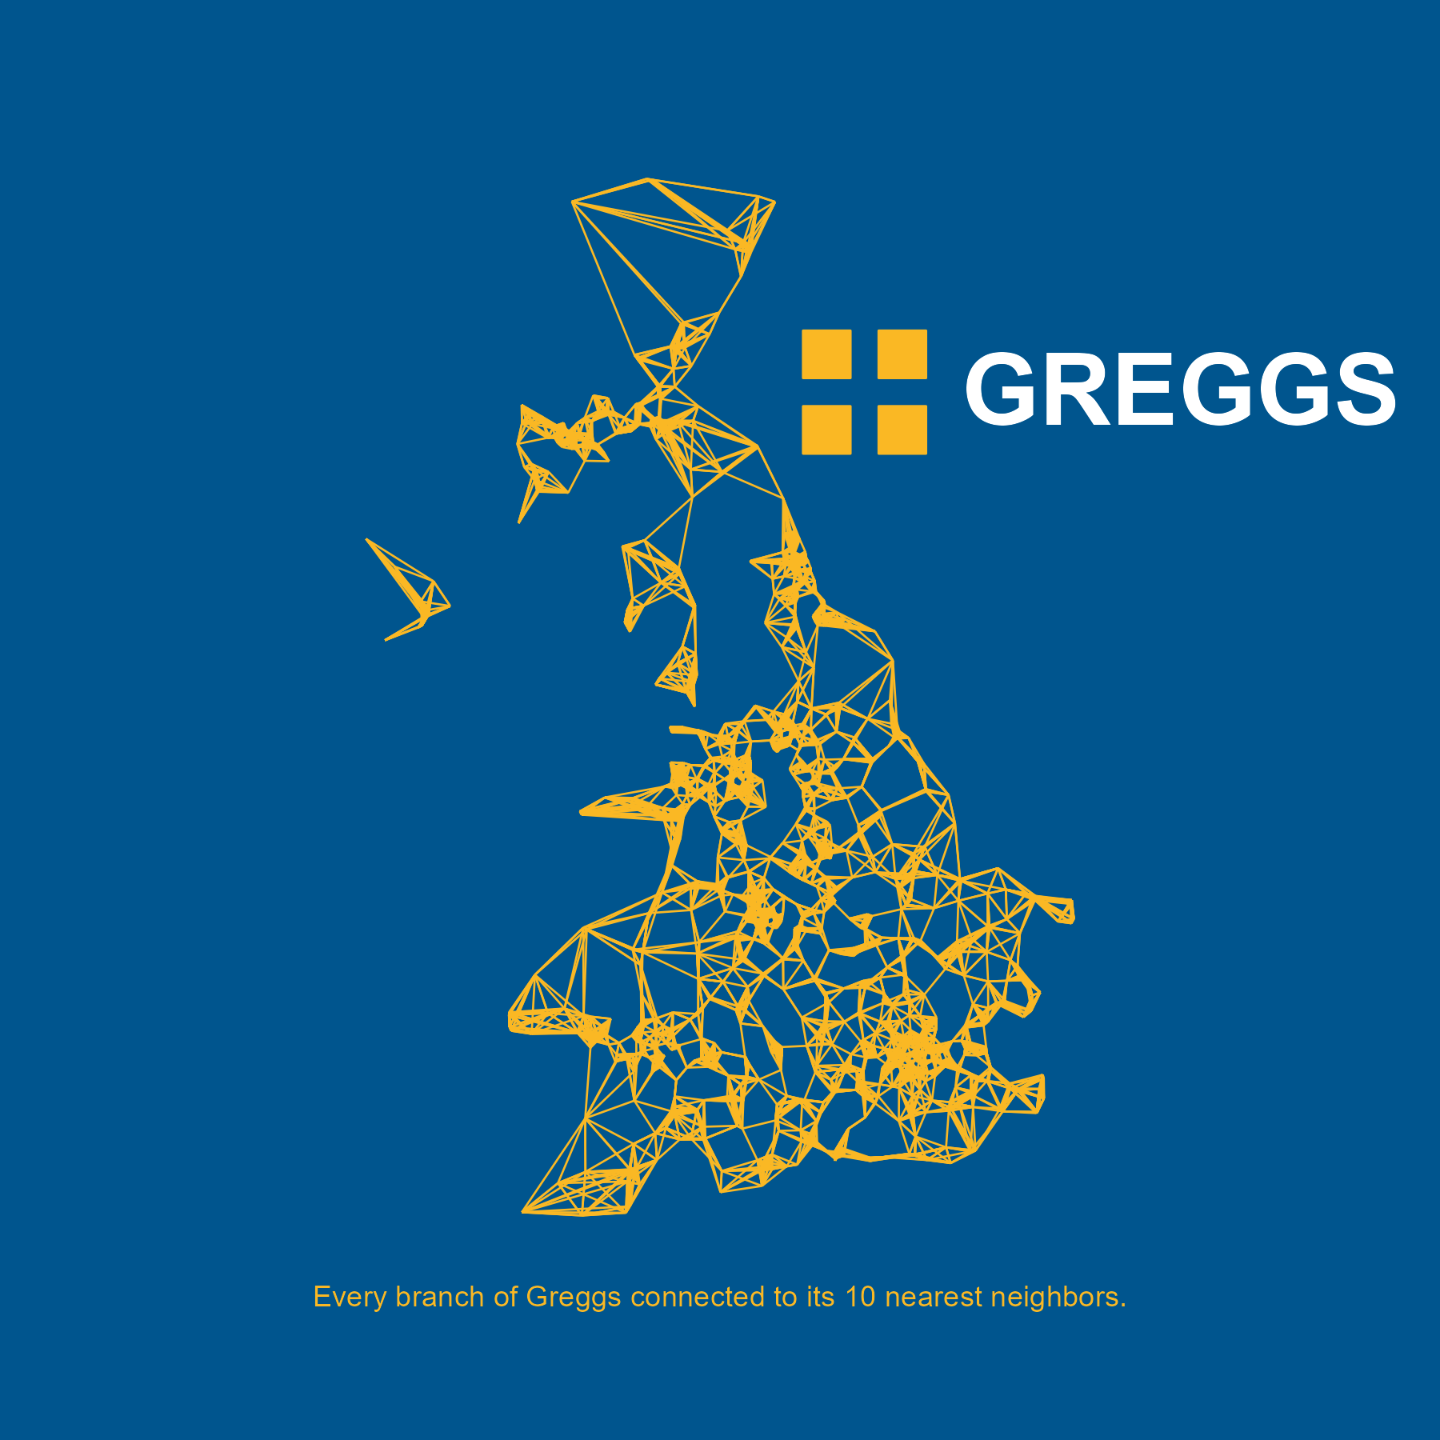
Half way through the #30DayMapChallenge! Obviously going back to the Greggs data for "Food/drink" theme on #Day15! Inspired by Abdoul Madjid (@issa_madjid on Twitter) to map every branch of Greggs connected to its 10 nearest neighbours 🍞
Code: https://github.com/nrennie/30DayMapChallenge/blob/main/2022/scripts/15_food_drink.R

"Try reading the following out loud:
Hashtag screenreaders for the hashtag blind and hashtag VisuallyImpaired read every hashtag HashTags out loud and so it's hard for people with hashtag VisualImpairment to get the sense of the post because it's being constantly interrupted by well-meaning hashtag accessibility hashtag allies.
Easier to read with a block of hashtags at the bottom:
#screenreaders #VisuallyImpaired #blind #allies #Hashtags #accessibility"
--original author unknown

Are you the kind of person who likes to spend hours exploring #HistoricalMaps of your neighbourhood? This might be exactly the thing for you... https://bothness.github.io/ons-basemaps/

Hello people of Mastodon & Fosstodon! Nice to be here with you.
We are a new project from the Royal Statistical Society - a #datascience content platform where students, practitioners, leaders & educators can share, learn about and be inspired by real-world uses of data science.
Our website is built on #Quarto. You can find us at https://realworlddatascience.net/ and on GitHub: https://github.com/realworlddatascience
#r4ds #rstats #dataviz #openscience #python #machinelearning #statistics #opensource
Tip 1: Use hashtags. There's no algorithm to suggest followers or shove posts into your feed in the hopes you follow someone.
Tip 2: Boost (re-post) toots liberally. *You* are the algorithm.
Tip 3: Use CW (content warnings / content wrappers) to discuss politics, the meta.
Tip 4: To create "threads", make the first post public and each reply "unlisted" to prevent clogging up your instance's feed.
Tip 5: Provide text descriptions, even just basic ones, when attaching photos or media.
Tip 6: Use the "report" features for moderating trolls so your admins can take action.

Some people think Mastodon is too weird to become popular:
I joined Twitter in 2008. We had to put a "d" in front of a tweet to convert it to a direct message and every other day you had some embarrassing private moments exposed because someone forgot about the “d”. Hashtags were just a community hack, introduced by Chris Messina to somehow tag content. Search? Hah, you wish! Tweets via SMS were supposed to be a thing. Oh, and the daily meet and greet with the failwhale. Totally not weird.
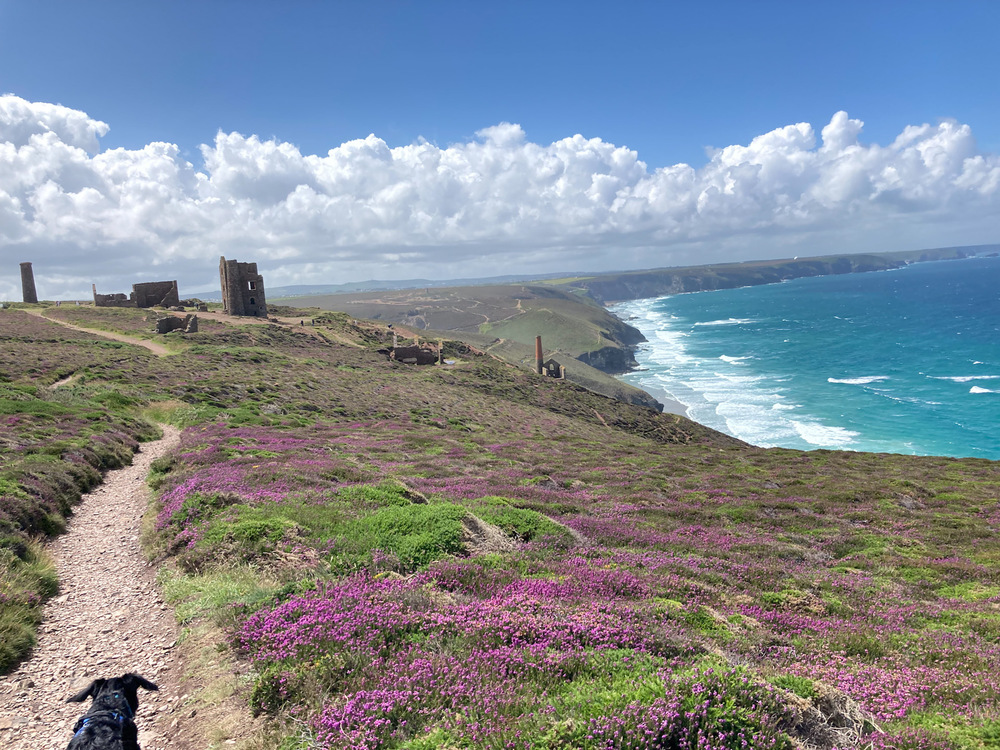
So, in inspiration for my #introduction I looked back at my first #birdsite post, it was "is being a sheep, baa." Seems appropriate as I'm joining in the #TwitterMigration 😆
When I'm done being a sheep who knows what I'll use this for as I wasn't engaging actively elsewhere before (other than posting dog pics on #instagram).
I work in reporting (or #dataviz to be all codewordy), largely in #QlikView but exploring #PowerBI and #Tableau.
Also, trying to refresh my coding from basics by doing #CS50x in my spare time.
- Country
- United Kingdom
Stats lover from South West England, now North beyond the wall.
