

@bitbonk @logseq It may help to hide the journals (and I wish I could hide property pages too). But if you keep everything in the journal (as it seems to be encouraged), the graph view doesn't show many connections, as it only shows pages and not blocks. I'm still a bit confused about the point of this.

@eldelacajita @bitbonk @logseq
Yeah it's confusing but let's try to make sense of it:
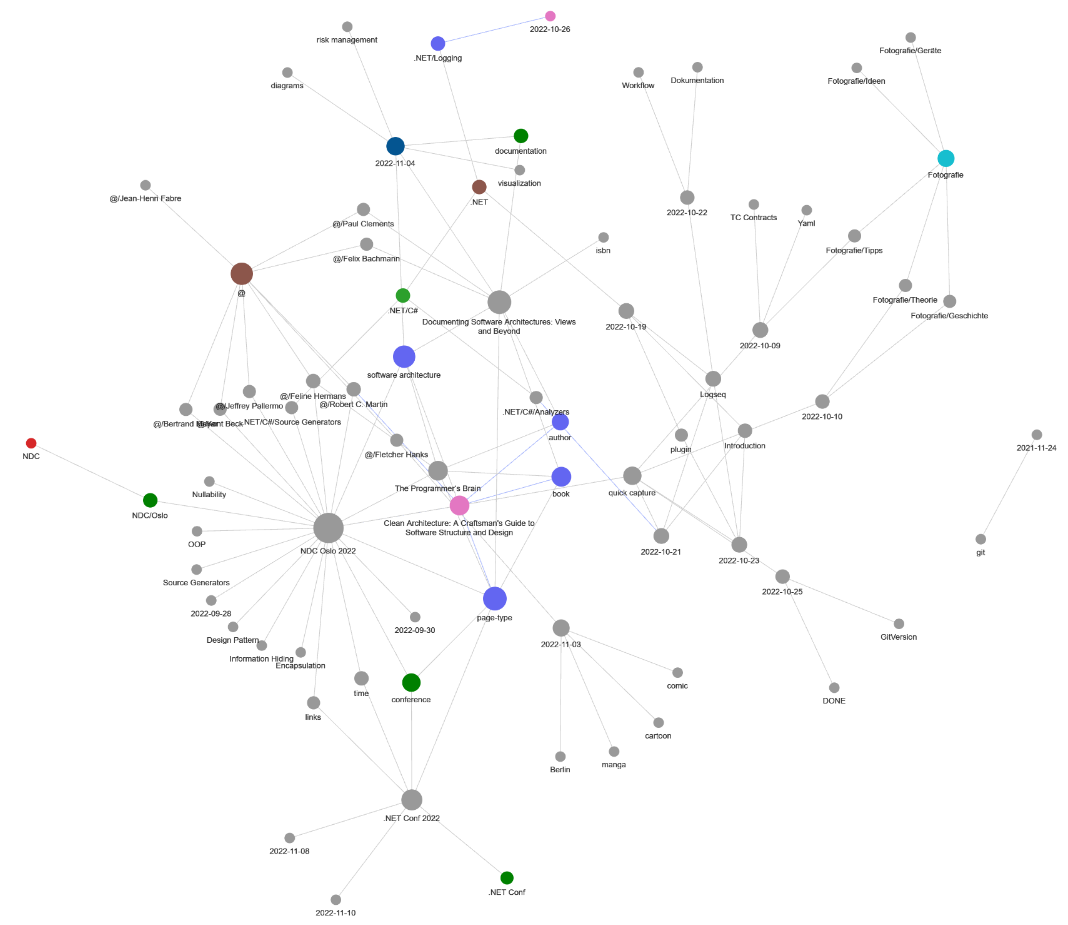
In Logseq the so called pages act as tags (no matter if using [[wikilink]] or hashtag syntax). And these pages/tags are nodes of a graph created using references as connections.
So while for every tag you have a page, it doesn't mean you need to write something in it. You may want to treat most pages as tags that will form a cloud of nodes in the graph view.
Using the journal only is an extreme option, that way you will treat every single page as a tag. Instead you can use a small number of pages to gather content but still using a lot of references to empty pages so that your graph is an accurate representation of the knowledge in your notes.
My advice is to use the journal as an inbox for quick notes, then move them to a few pages and once a page become as long as the chapter of a book, move a portion of its content to another page.
@post @bitbonk The thing is, if you just use the journal pages and leave the other pages as empty "tags" (as it seems to be intended by design), the graph won't show any connections between those "tags", because the block-level links (references) aren't displayed.
So if I use #Logsec as intended the graph will be useless.
For it to show a proper network of concepts, all blocks should be in the pages, which would become containers and not only empty "tags".
But if you use the "everything into pages" approach to make the graph view show those links, the linked references section in each page becomes less powerful, as most of the related blocks will be inside the page and with no such filtering features.
And if I combine both approaches (some things in the journals, other things inside other pages) the resulting graph will just show half the picture, which can be even more misleading.
Or am I misunderstanding something?
Indeed the graph view is not meant to be that useful, it's just a nice visualization.
A graph is a data structure and the visualization you see in Logseq is just a portion of what Logseq built from your notes i.e. it's the graph where nodes are pages/tags and connections are references, but there's more under the hood.
Logseq uses this graph to provide its features including performant queries and it stores it in a particular flavor of database, a "graph database", that is different from relational DBs you see for example in MS Access, Notion, MySQL.
What's can be improved are queries to properly traverse the graph and extract useful visualizations like tables and other goodies you see for example in Notion. Think of the graph as the engine that can power all sort of data visualization.
On the why Logseq provides that graph view, simply "why not?"; it's a nice overview and ones shouldn't expect more. I know that it may seem like a prominent feature of Logseq but it's just because powerful queries and visualizations are still not there.
