Follow

RT @mausraster
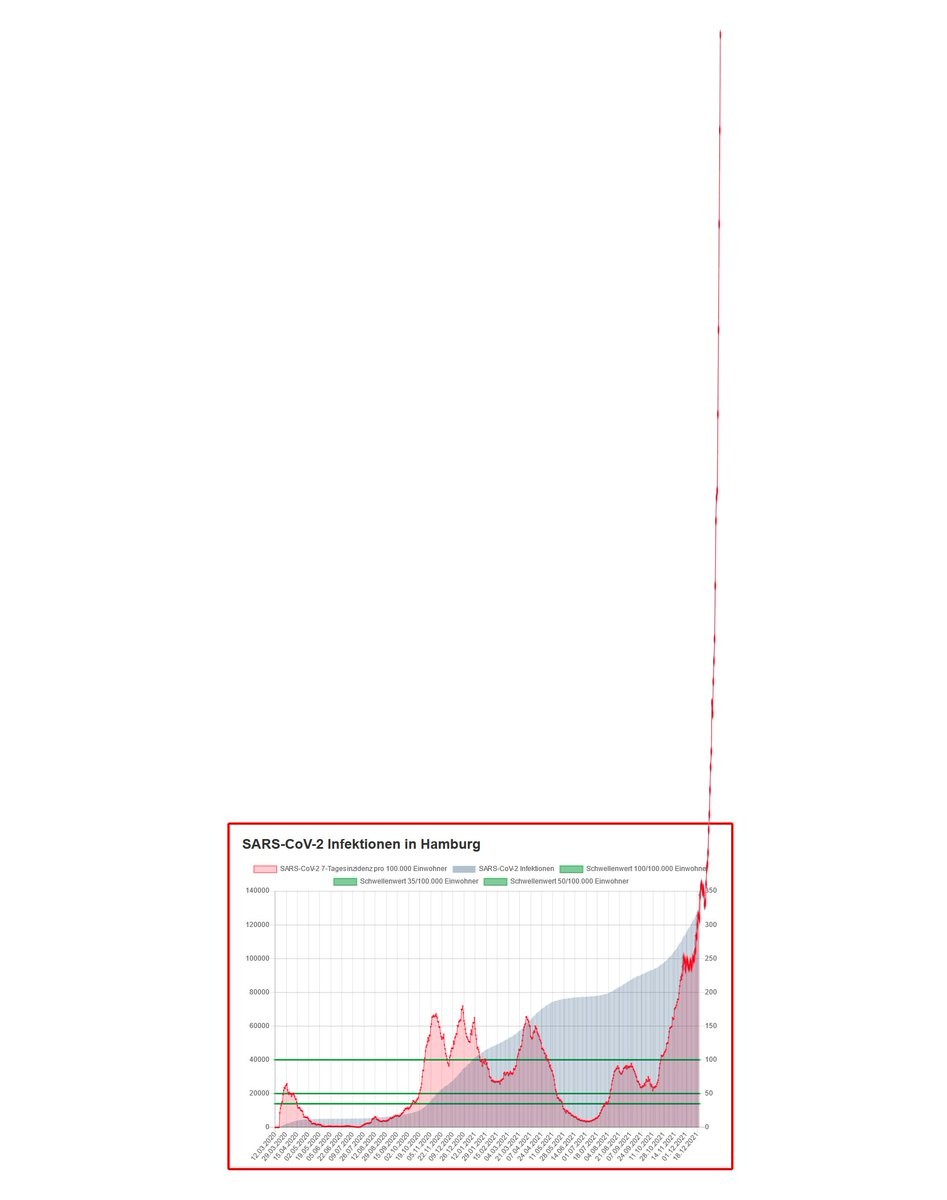
#Hamburg #Covid19
So sähe der Verlauf der 7-Tage-Inzidenzen aus, wenn man die y-Skala seit dem 21.12.2021 nicht angepasst hätte.
Ursprungsbild: http://hamburg.de/corona-zahlen vor einem Monat (21.12.21), Graph bis heute 21.01.22 hinzugefügt.
#CoronaHH
