uwekraemer @uwekraemer@qoto.org
Environmental engineer. Photography. UNIX.
Hamburg Eppendorf, Germany
Can even fold fitted sheets :-)

First global sea level rise update of the new year (through January 2023) - surprise, it's still going up...
This graphic is produced by https://aviso.altimetry.fr/en/data/products/ocean-indicators-products/mean-sea-level.html
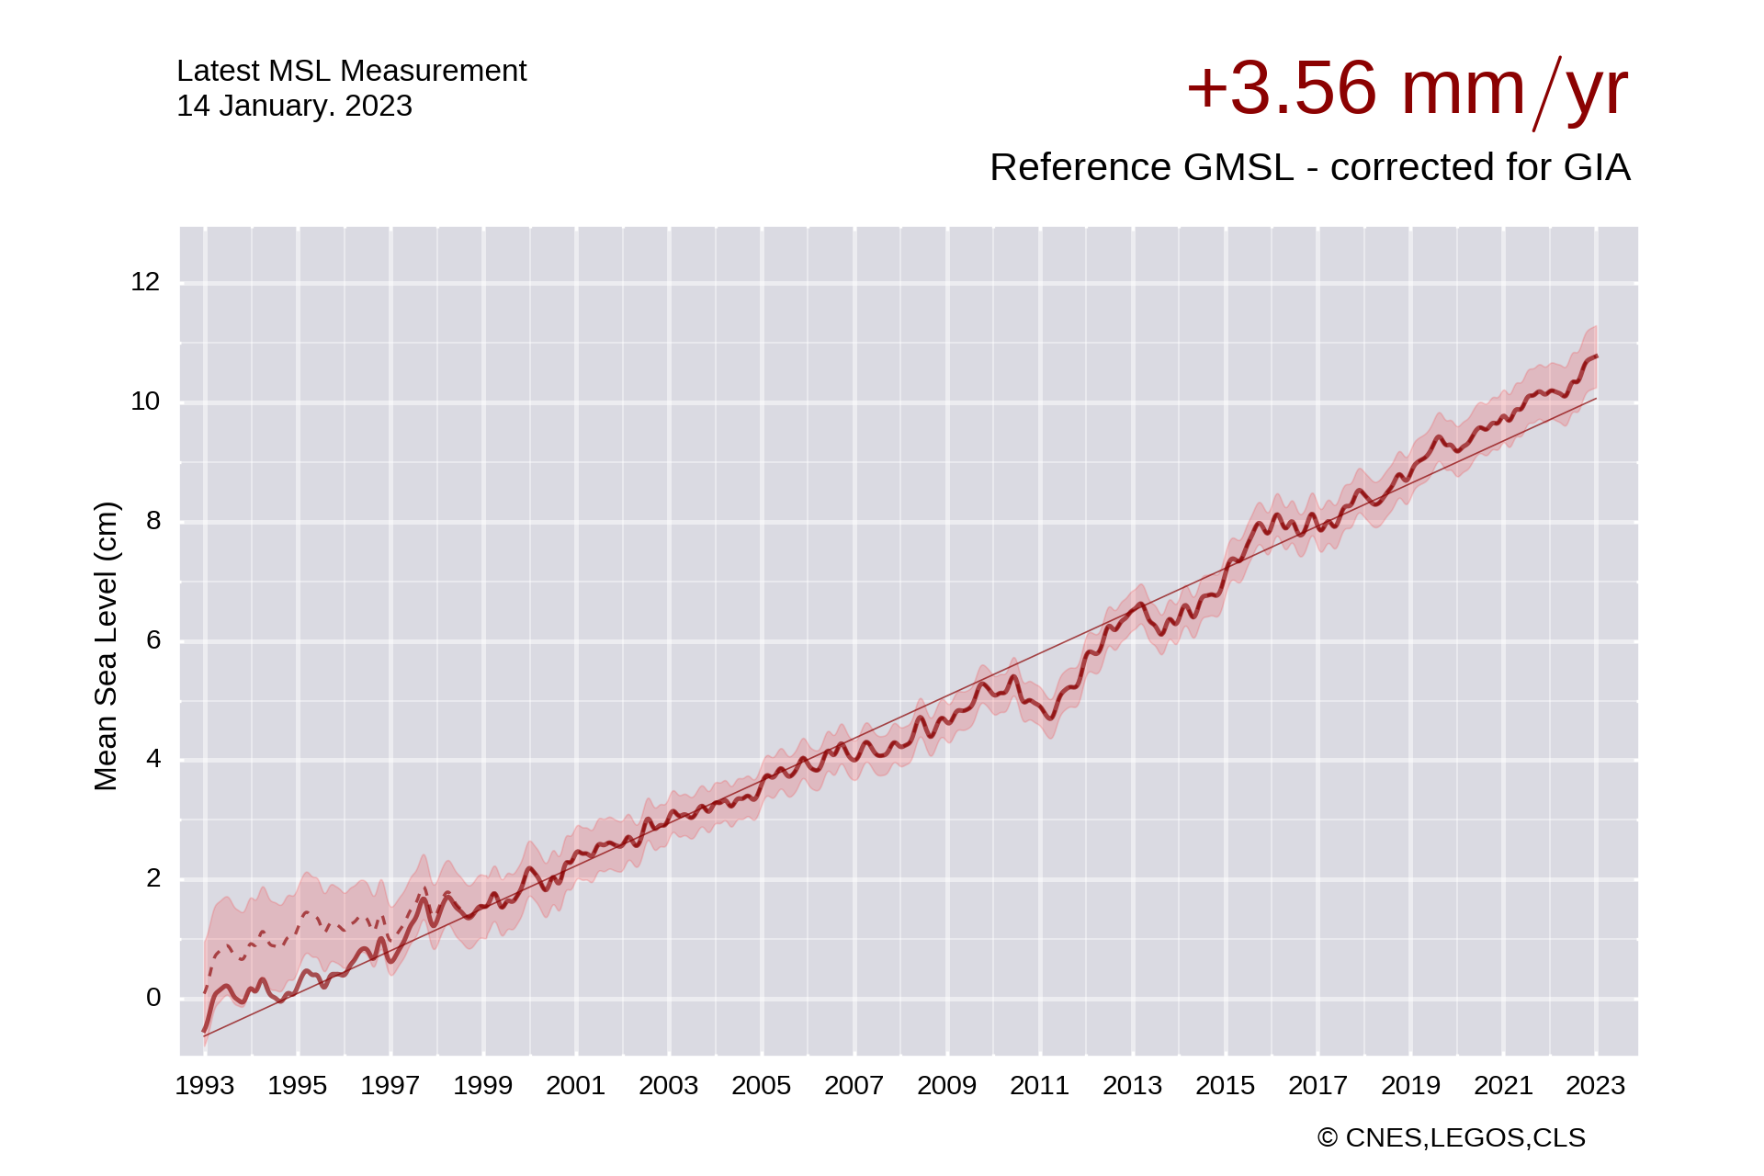
My climate change indicators page continues to grow... https://zacklabe.com/climate-change-indicators/
I am adding a graph of actual global temperatures by year (using ERA5 data). In other words, NO anomalies here. Hopefully, this will limit some of the trolling messages, sigh.
I'll add 2022 as soon as the final ERA5 monthly product is available! This graph will be updated annually.
100 years of December sea surface temperature anomalies through 2022. Note the long-term warming and patterns of climate variability, like from this year's La Niña (cooling in the equatorial Pacific).
[Data from ERSSTv5 at https://ncei.noaa.gov/products/extended-reconstructed-sst]
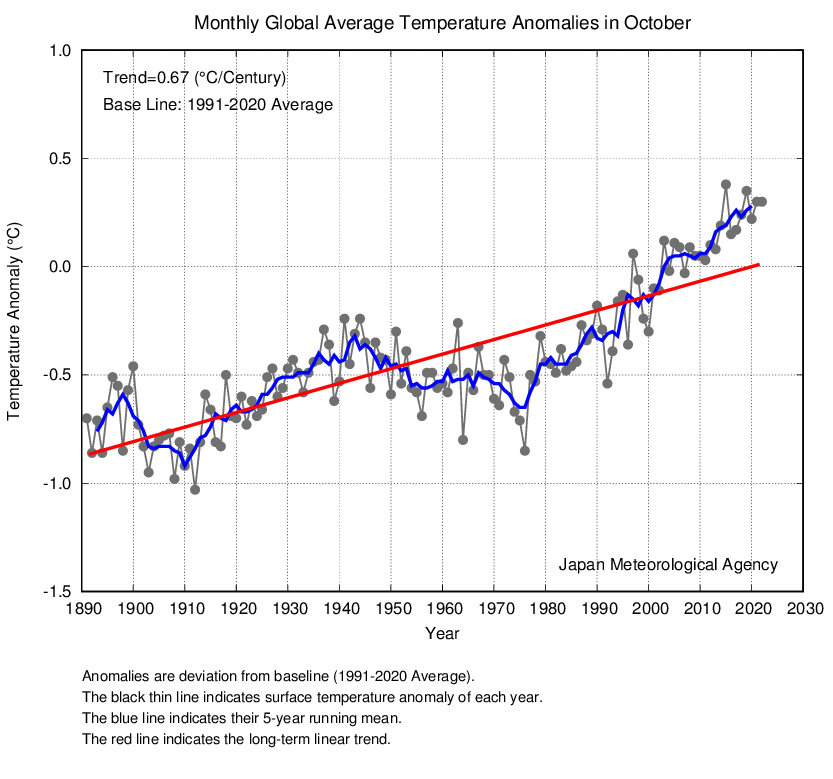
Top 5 warmest October global temperatures since at least 1891 - Japan Meteorological Agency (https://ds.data.jma.go.jp/tcc/tcc/products/gwp/temp/oct_wld.html). Small differences in ranking are normal between data sets.
1. 2015
2. 2019
3. *2022*, 2021
5. 2018
Environmental engineer. Photography. UNIX.
Hamburg Eppendorf, Germany
Can even fold fitted sheets :-)
