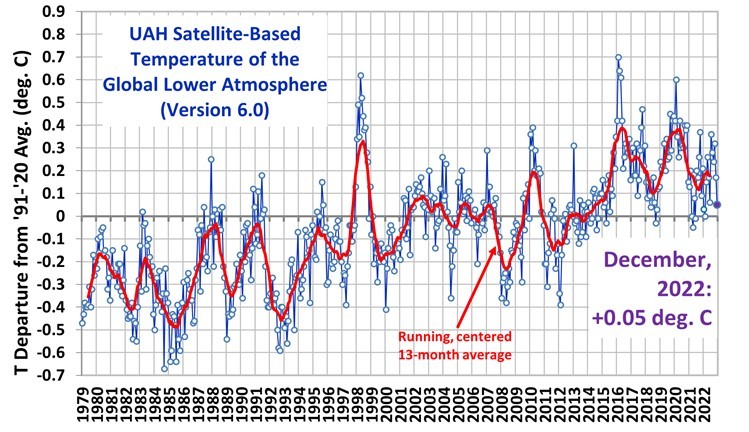
**Spencer world temperature plot down** Sat plots work like a 'no touch' thermometer. They read infra-red and microwave energy from warm air or the surface. The Spencer plot follows most of the other plots that come later in the month.

Follow

The noaa tide gauge plots correlate well with this plot, but they are all very late now.

Sign in to participate in the conversation
Qoto Mastodon

QOTO: Question Others to Teach Ourselves
An inclusive, Academic Freedom, instance
All cultures welcome.
Hate speech and harassment strictly forbidden.