
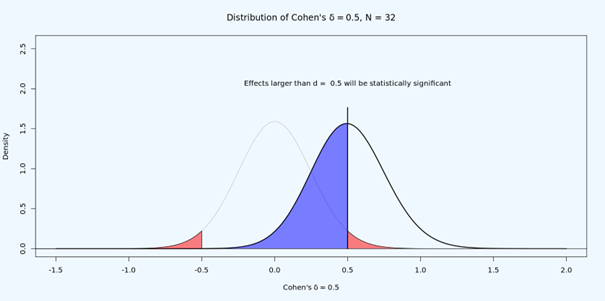
Why is it difficult to interpret null results in underpowered studies? Below, you see a study with 50% power for an effect of d = 0.5. Let’s say the observed effect is d = 0.3, so p > 0.05. What do we do?
It could be that the null is true. Then we would observe non-significant results 95% of the time. It could be that there is an effect, but this is a Type 2 error – which should happen 50% of the time. How can we distinguish the two?
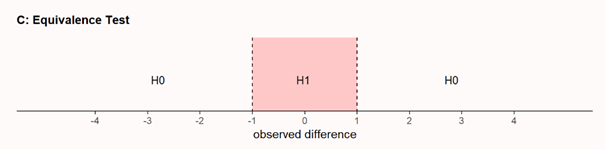
The answer is, we can’t. But what we *can* do is to test if the effect, if any, is statistically smaller than anything we would care about. This is done in equivalence testing, or inferiority testing. Is the effect within some range (or below some upper value) we think is too small to matter.
If you design a study, you need to make sure you can corroborate or reject the presence of a predicted effect. Combining NHST and equivalence testing, you can now end up with a *conclusive null result*. The effect, if any, is smaller than what you care about.

The solution for such problem is already known for 90 years.
1) specify your model
2) test your model against probable alternatives
