#30DayChartChallenge #30DCCNov22Reposts #Day13 - Topic: correlations
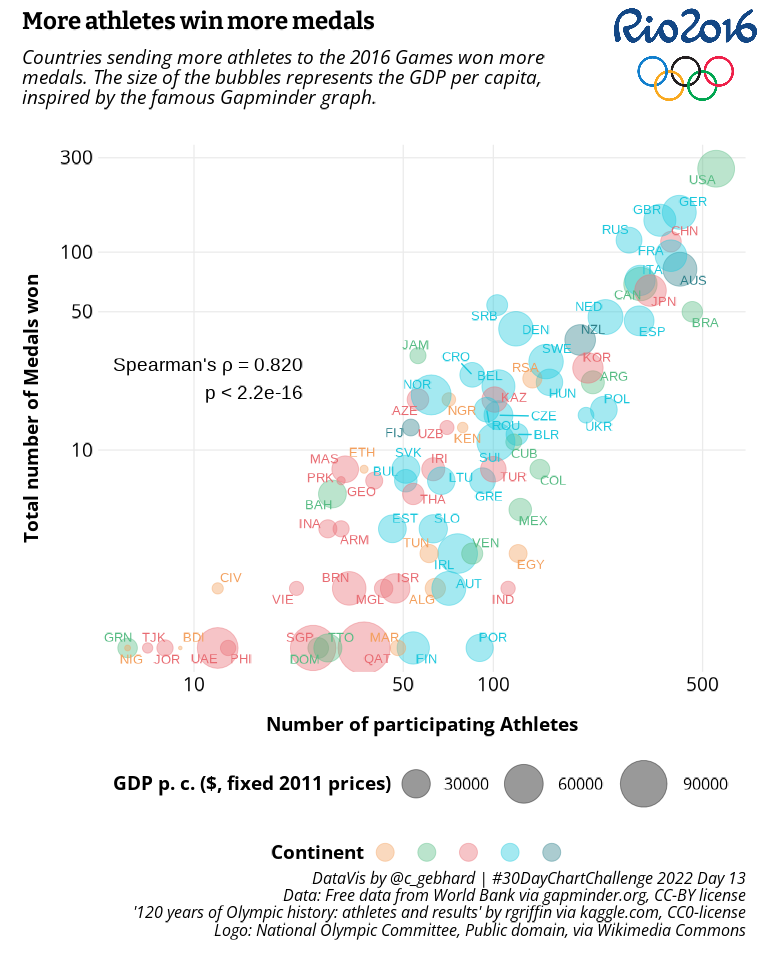
For this day I updated a plot from a while back: correlations at the 2016 Olympic Games.
Inspired by the iconic Hans Rosling plot.
Tool: #rstats
Data: Gapminder, WorldBank, kaggle user rgriffin
Code: https://jollydata.blog/posts/2021-01-01-olympic-history/#bringing-it-all-together
#datavis #dataviz #olympics2016 #olympics #sports #gapminder #WorldBank


