
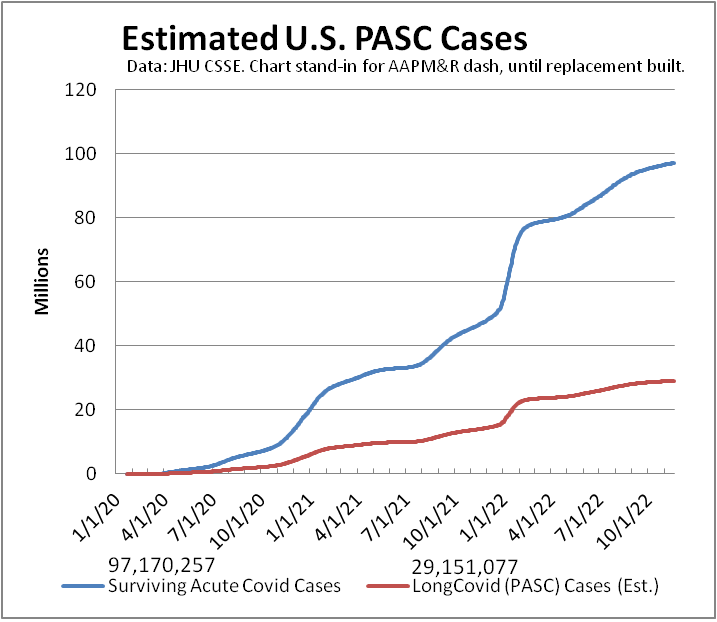
#LongCovid dashboard USpol
Another week, another ~80,000 on #LongCovid dashboard. (Metric depends on testing)
Media reports of 30 million.
Extrapolate latest Census survey—self-reported subset of symptoms—estimate to all ages: ~39 million.
Not counted: new risks of morbidity/mortality.
#ThisIsOurPolio #CountLongCovid
#CovidIsNotOver #MassDisablingEvent
[This is first toot of a weekly thread, updated daily, providing various dataviz of ongoing #pandemic.]
Last week: https://mastodon.social/@beadsland/109339066426302803
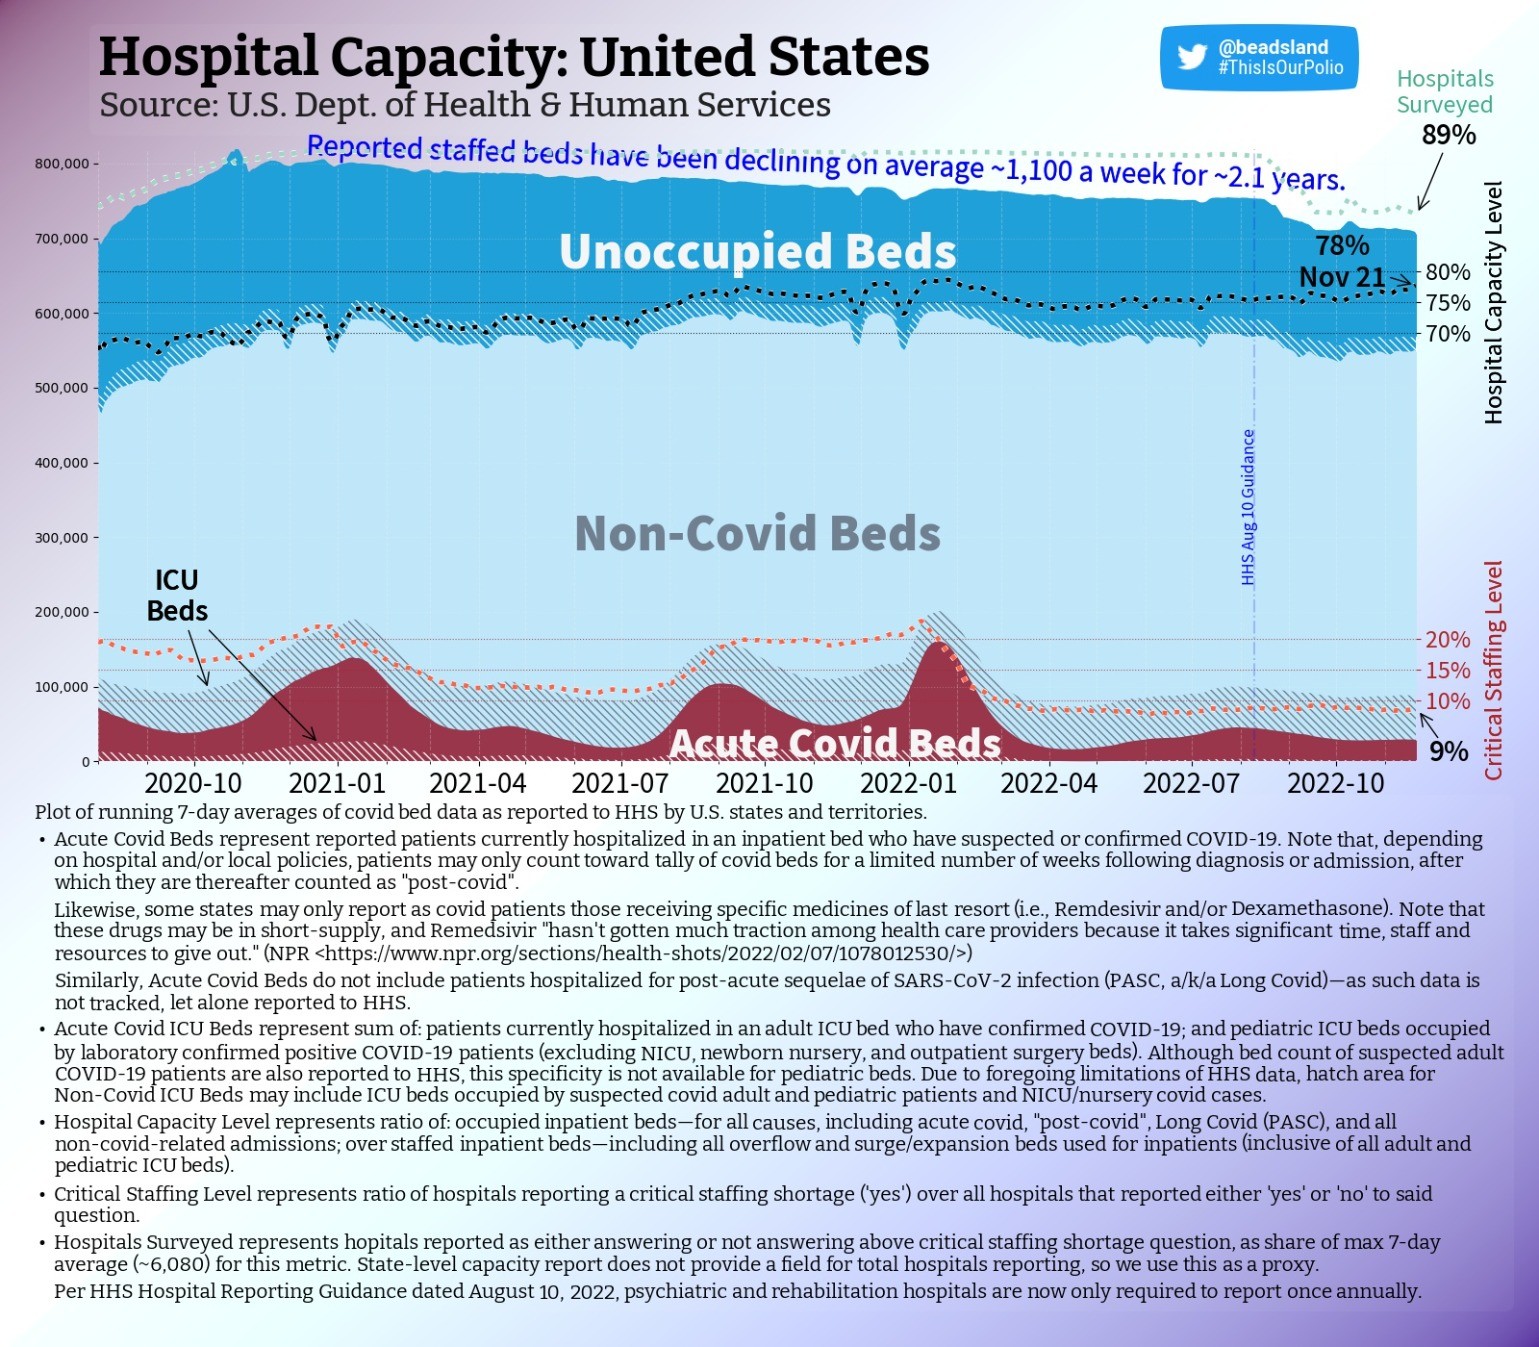
hospital & ICU capacity trend USpol (also dog & food metaphor)
National capacity level holds, as occupancy climbs steadily & hospitals surveyed gains a point.
We're in transition period, ramping into northern hemisphere influenza season, as RSV spreads & Cerebrus slaver-broth Typhon se gang comes to shaggy boil across U.S.
#ThisIsOurPolio #hospitals #LongCovid #CovidIsNotOver #nurses #MassDisablingEvent #CovidIsAirborne #BringBackMasks #dataviz #datavis
pediatric & PICU capacity trend USpol
Pediatric staffing never recovered to pre-omicron levels.
Pediatric capacity level drops a point as non-critical occupancy mirrors plummeting number of beds staffed.
PICU occupancy continues on steady upward slope. More critical patients—fewer doctors & nurses.
#ThisIsOurPolio #pediatric #hospitals #pedsICU #RSV #Flu #LongCovidKids #CovidIsNotOver #nurses #MassDisablingEvent #CovidIsAirborne #BringBackMasks #dataviz #datavis
pediatric & PICU capacity map USpol
Over 282 (-22) counties have pediatric care near or over capacity (≥90%).
Of these, eleven are High "Level"—per CDC—near four in five only rate Low.
Full but Low.
Of 110 counties that report having any PICU capacity, near one-third are full or over capacity.
#ThisIsOurPolio #pediatric #hospitals #pedsICU #RSV #Flu #LongCovidKids #CovidIsNotOver #nurses #MassDisablingEvent #CovidIsAirborne #BringBackMasks #dataviz #datavis
pediatric & PICU capacity rank USpol
Counties by pediatric capacity—colored per CDC "Levels":
#1 🟡Eagle, CO ≥150% (Medium)
#2 🟡Yavapai, AZ ≥150% (M)
#3 🟡Coconino, AZ ≥150% (M)
#4 🟡Oxford, ME ≥133⅓% (M)
#5 🟡Lauderdale, AL ≥150% (M)
#6 🟢Marion, OR—140% (Low)
#7 🟢Florence, SC—136% (L)
#8 🟡Manati Municipio, PR—127% (M)
#9 🟢Fairfax, VA—126% (L)
#10 🟢Wood, WV—125% (L)
[Darkest counties on map tooted above.]
#ThisIsOurPolio #RSV #Flu #LongCovidKids #CovidIsNotOver #BringBackMasks
adult hospital & ICU capacity map USpol
That few beds count as "covid" doesn't mean space is available if you get sick or injured.
Of 96 (-1) counties ≥ 100% capacity per HHS data, only FOUR are CDC High "Level"; just 15 are Medium.
Those ≥ 90% down—266 (-10).
For counties with ICUs, 15% are full.
#ThisIsOurPolio #hospitals #LongCovid #CovidIsNotOver #nurses #MassDisablingEvent #CovidIsAirborne #BringBackMasks #dataviz #datavis

adult hospital & ICU capacity map USpol
@beadsland I’d like to see this adjusted by population in a couple of ways.
One to highlight where there was preexisting undercapacity (under-served areas), and another to highlight where utilization is high relative to initial supply.
If you use a national average per-capita number of beds as the denominator, I think you get the latter, because it removes local supply from the equation.
For the first, perhaps subtracting the local shortfall from the denominator/adding the local surplus? This is an artificial metric; it gives a mix of signals—adequacy + disease burden.
Another way to mix might be to subtract normalized utilization from the actual utilization.
Raw utilization itself is a mix of capacity adequacy and disease burden. This leaves me with the question of contribution of each of these factors, as well as how they may relate.
The existing map is ideal for answering “if I get sick, what will the situation be when i end up in the ICU”, which is certainly an important question to answer!
adult hospital & ICU capacity map USpol
@BobKerns The challenge of per capita is how to reflect differences in rural vs urban coverage areas.
All those areas where there are no ICUs, for instance, are served by regional counties that do have ICUs. Compare a city like NYC, where one one can expect to be at worst transferred to an ICU a few miles away under normal conditions, to someplace in the Dakotas where an ICU may be half a state away. This begs the question per capita of what area?
1/3
adult hospital & ICU capacity map USpol
@BobKerns CDC addresses this partly by having designated Health Service Areas that constitute contiguous areas of multiple counties--this being part of basis for their (very problematic) "Levels" semiotic.
"Underserved" is interesting idea: implies a baseline of population health, in turn a function of socioeconomic demographics. That said, yeah, some counties appear pretty consistently among top 10 each week, which might read as inadequate "supply".
2/3
adult hospital & ICU capacity map USpol
@BobKerns Not sure what you would expect "normalized" utilization to achieve but add a layer of abstraction.
If your question is about capacity vs. occupancy (different from disease burden, as occupancy includes elective procedures that may be or have been deferred for extended periods; may not reflect patients sent home early to make room), see the national charts above in this thread.
As for "when I end up in ICU": this assumes any beds in ICU.
3/3
dataviz: regional stress in national context
@BobKerns Another note regarding "what will the situation be":
As staffed beds is a measure of staff, not a measure of architecture, the situation stops being terribly clear once we approach or exceed 100%.
A hospital at 100% could be two beds full in every room. Or it could mean patient treatment on gurneys in the cafeteria and parking garage.
What we do know at that point is that patient care is not of the quality one would expect at 80% capacity.
dataviz: regional stress in national context
@beadsland That’s a very good point! Is data available on physical vs staff capacity? Even that obscures equipment limitations, etc.
The ultimate reason to ask these questions, is to marshal the needed resources to fix them. Major capital expenditures vs staffing have very different pathways.
dataviz: availability of data
@BobKerns Yeah, the only reason we have staff capacity is due to the pandemic, this data only exists in relation to covid-19 beds. Worse, HHS hands over management of this data to the CDC in January, after which...
Statistics are structural.
So no, physical capacity data does not, to my knowledge, exist. Let alone real-time data about triaging equipment and supplies due to materials having been ordered for fewer patients than being provided for.
1/2
dataviz: availability of data
@BobKerns That said, once we start getting into long-term questions, it perhaps stops being about datasets and more about data collection.
Major capital expenditures vs major budget increases for hiring and retention are questions answered at the local level. One can always examine floor plans at the local level to gauge physical capacity.
This doesn't address there being fewer employable doctors, nurses, techs, etc. than there were two years ago, however.
2/2
dataviz: availability of data
@beadsland While many issues rest in the hands of local decision-makers, my thinking goes toward establishing standards of care. And also, identifying excellence.
Yes, it absolutely becomes about data collection. I’ve been disappointed in our data collection at every turn. I expected we had more to build on from global influenza surveillance, Inconsistent categorization ran rampant and was frequently changed.
The middle of a crisis is no time to be sorting these things out, but people heroically did their best, except for the politicians who should have funded the preparation in the first place!
I don’t think non-data people really appreciate the value of consistent collection practices. Consistent both between reporters and longitudinally.
But I preach to their choir here.
dataviz: consistency of data collection
@beadsland A lot of the chaos I saw was from there being no shared process at all, which too often opened it to political manipulation and wishful thinking.
Sure, we always have to adjust the data to mitigate inconsistency. And then total laymen will come along and accuse us of “manipulating” the data. Having followed influenza data for year, I just expected more planing and preparation than turned out to be the case. I’m convinced we could have done better—but not by making decisions state-by-state and county-by-county on the fly.
I’m reminded of when ocean temperature data showed an unexpected rise. It was traced to a change in how measurements were collected—manual over-the-side measurements, vs engine cooling water inlet temperatures. Easily adjusted for when identified. Climate deniers screamed about the adjustment!
I once lit into David Sirrota for publishing a number—% of donors with oil ties, but stripped of the context that Beto was running in a state where much of the population had oil ties, and his comparisons were not. He INSISTED he was JUST REPORTING THE FACTS, doing data journalism. But stripped of context, it ceased to inform and instead mislead. A statistic is never just a number (and it’s a stand in for a probability distribution, but let’s not get into that).
I felt vindicated when he later went to work for the Sanders campaign!
I always wanted to do a visualization of how COVID case rate curves evolved with time, as reports came in with varying delays. The delays were part of the situation often ignored, leading to premature gloating of “progress”.
I didn’t overcome the challenge of locating the necessary “time series of time series datasets”. I should have bit the bullet and collected it myself, collating the periodic individual time series.
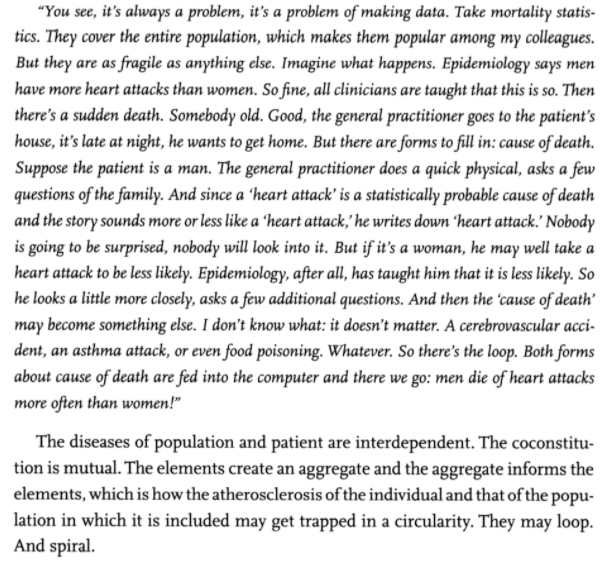
So of course, I love your quote, and the mortality data it gives! Epi model predictions in general are self-invalidating, to the extent anyone pays attention and acts on them, changing the situation.
And then, of course, that becomes “evidence” that the models are “wrong”.
Anyway, i do understand how challenging data collection is. I didn’t mean to suggest that I expected consistency. I just expected that influenza surveillance would have been a template that would have saved a lot of early iterations. A new reportable disease isn’t really a new situation.
If US lawmakers had funded an international effort on emerging disease surveillance, I have little doubt it would have existed.
dataviz: culpability of data collection
@BobKerns Our #RentierSociety is one that has for generations allowed preventable deaths by influenza year after year, because despite what data surveillance was in place, it wasn't something we, as a society, were going to act upon.
That would have implicated the choices of those who didn't die of influenza, but merely participated in its spread, and we weren't gonna go there. The new situation only cast that #perquisitive silhouette in stark relief.
2/2

dataviz: culpability of data collection
@BobKerns Ah, but now we're getting back to the question of whether disease surveillance is something we as a society want: if it is something we want to know.
For with such knowledge comes responsibility. Specifically, responsibility to act. Unfortunately, such action is not simply the responsibility of politicians, but the responsibility of the members-in-part of society-as-whole for which those politicians are merely representatives.
1/2