
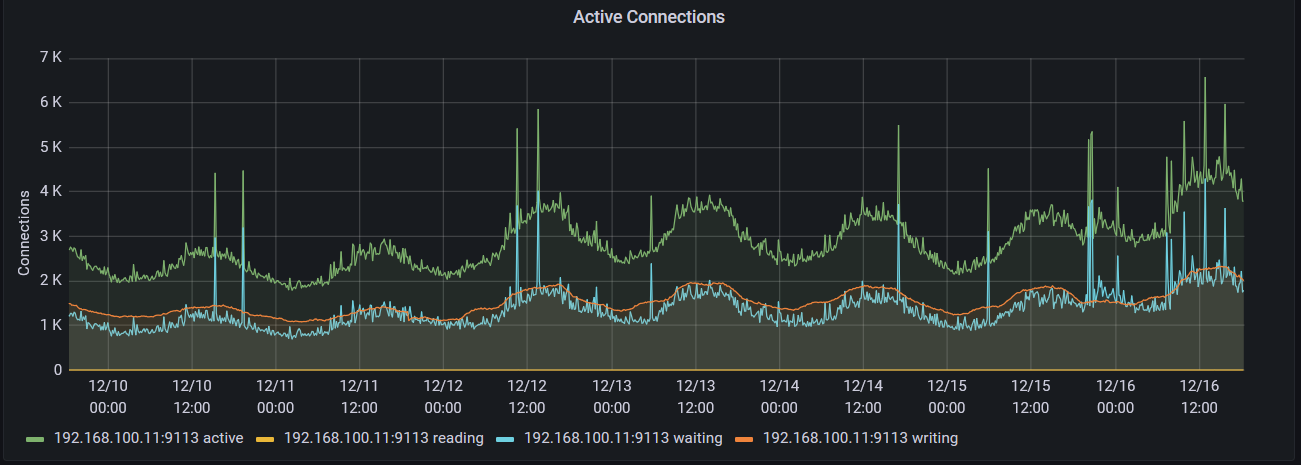
Now at 1700 new accounts on the day @infosec.exchange. This is what it looks like on the load balancer:
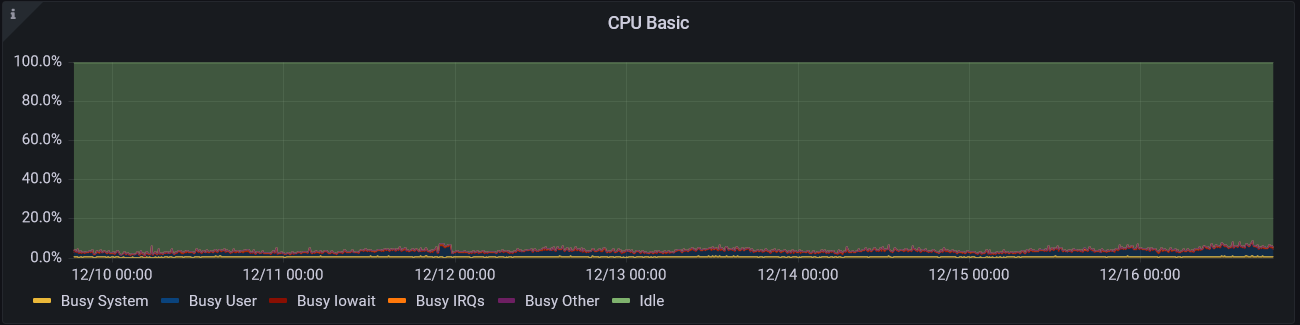
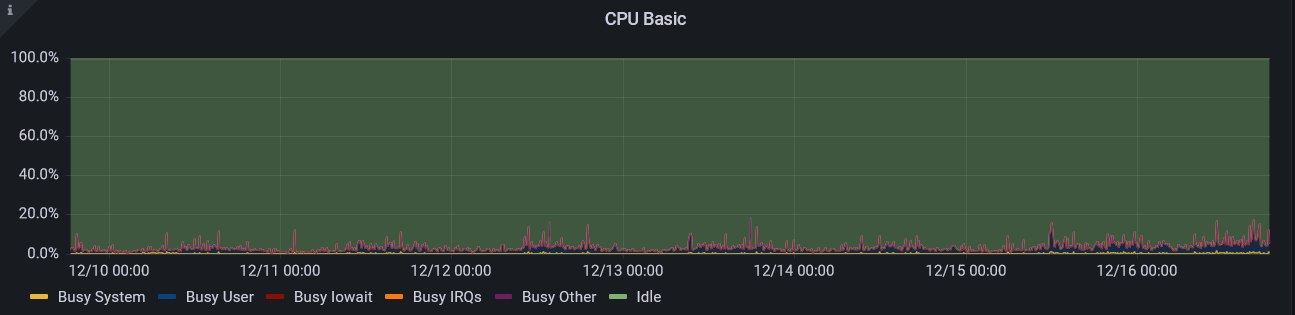
And this is what the aggregate CPU on the PUMA servers look like (note, almost no change)
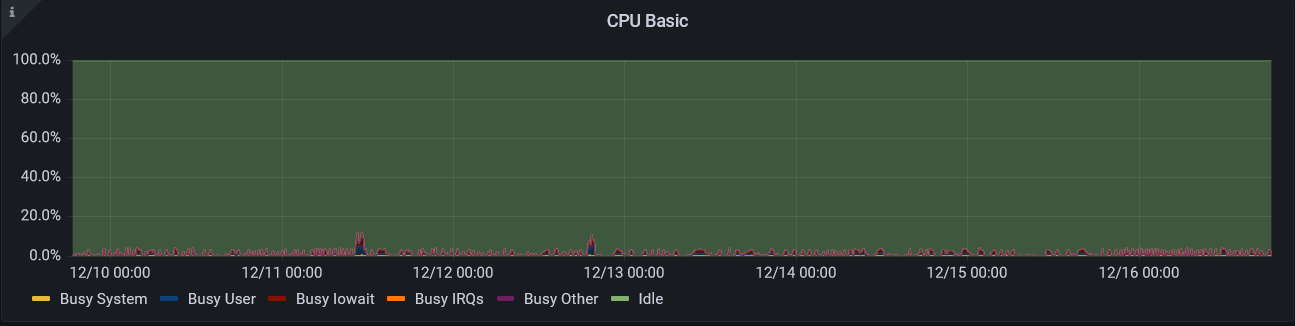
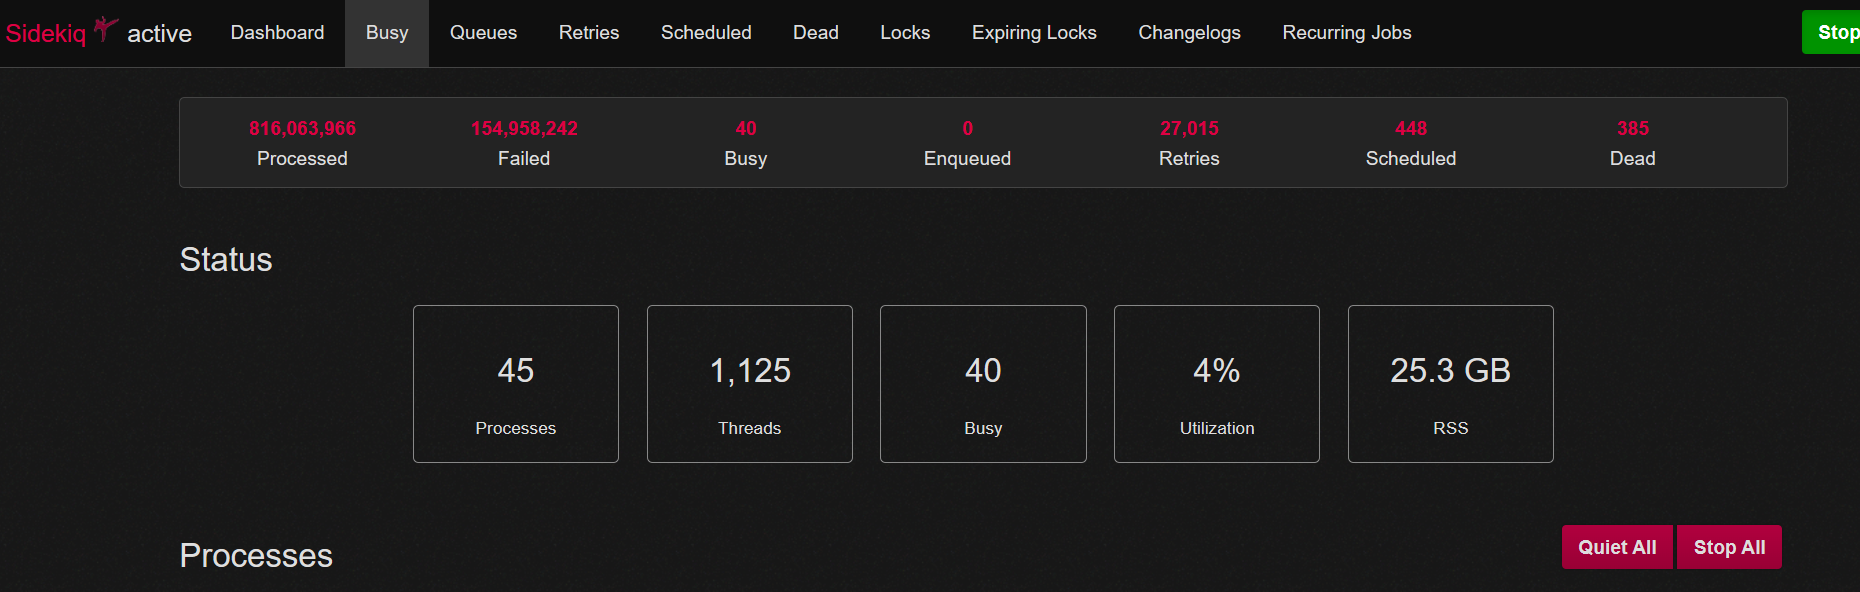
And this is the aggregate load on the sidekiq servers (also, nearly no change)
CPU on the redis/elasticsearch server. I can barely find it:
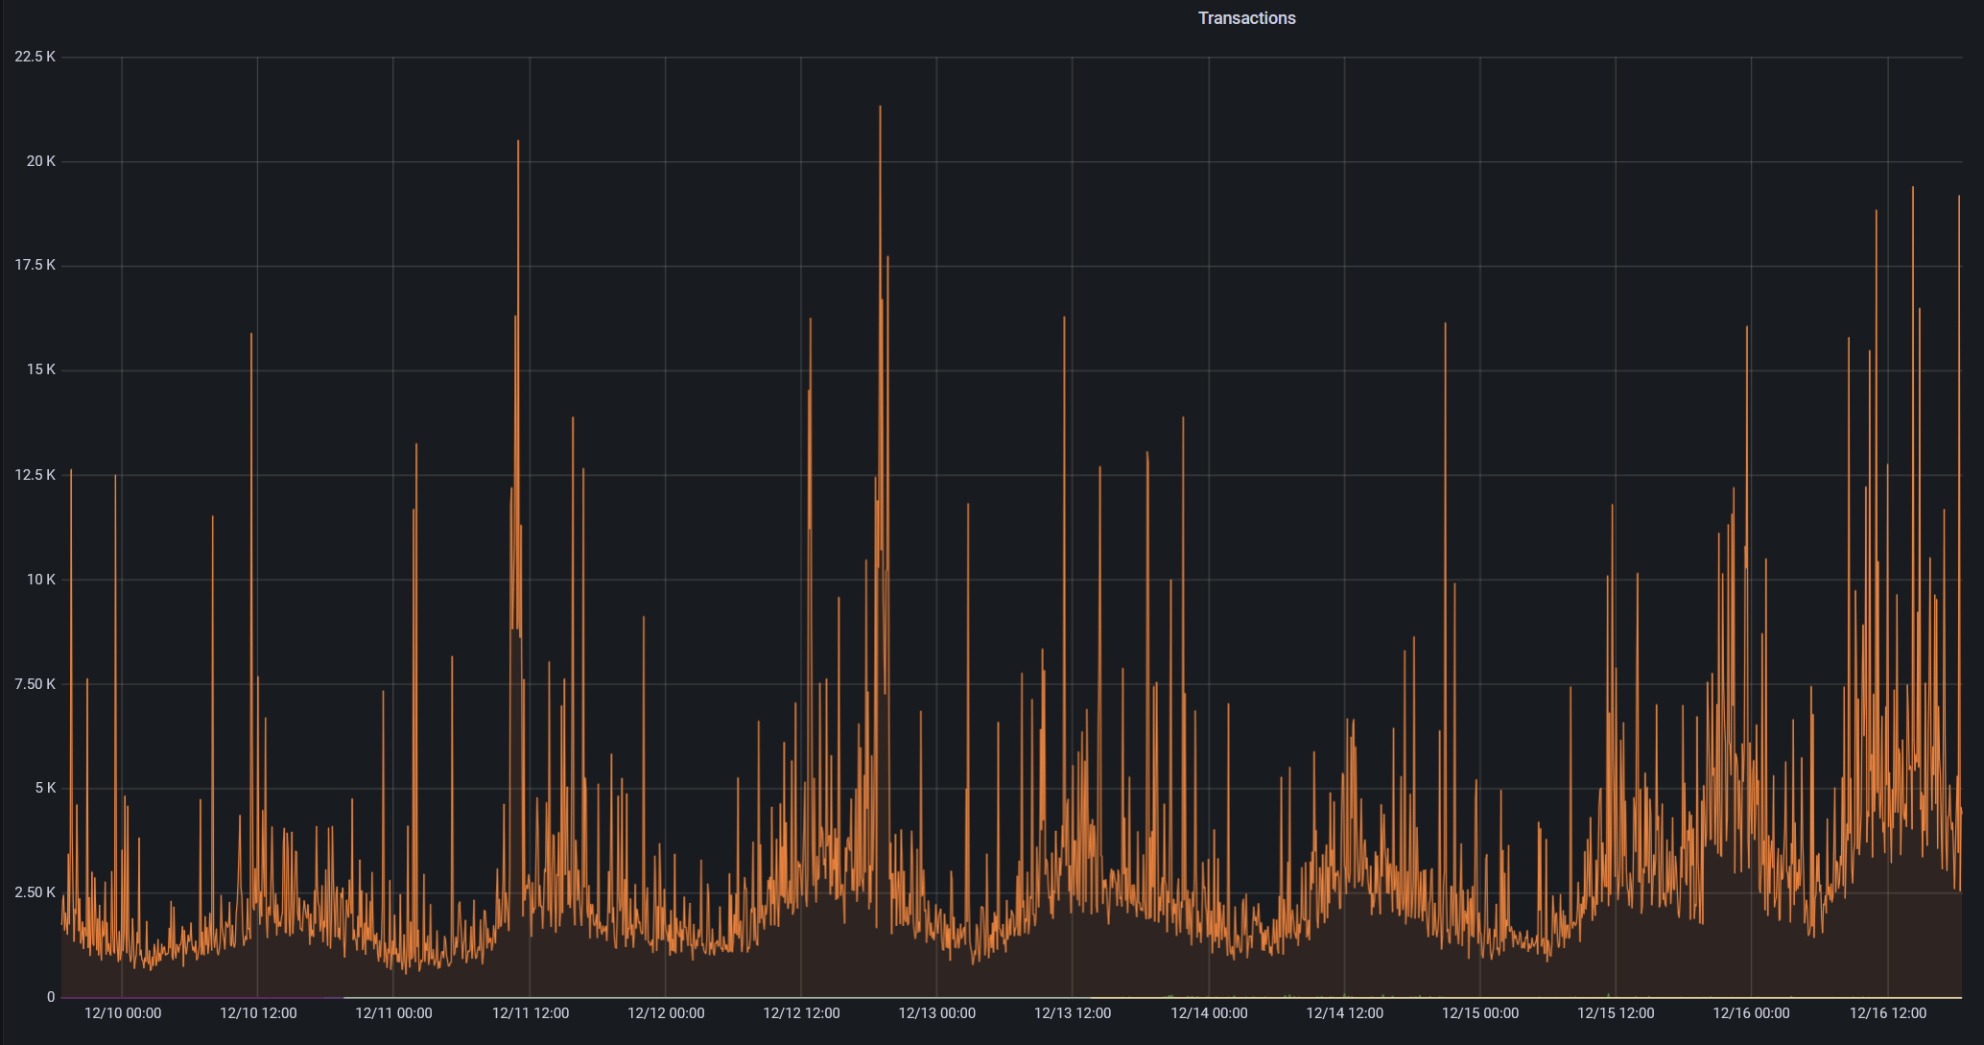
final graph (I don't have much else that would be interesting) is the sidekiq graph:
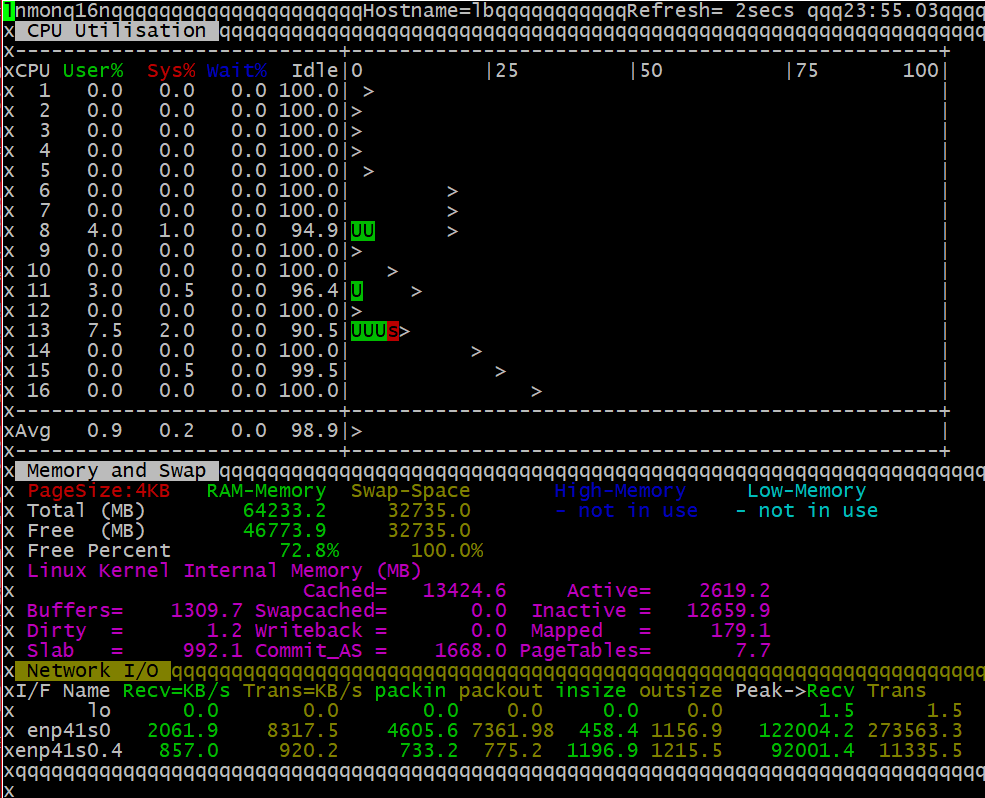
I lied. One more. I feel bad that I am just now realizing I didn't tell Prometheus to monitor the load balancer, so here is a snapshot of nmon from the load balancer:

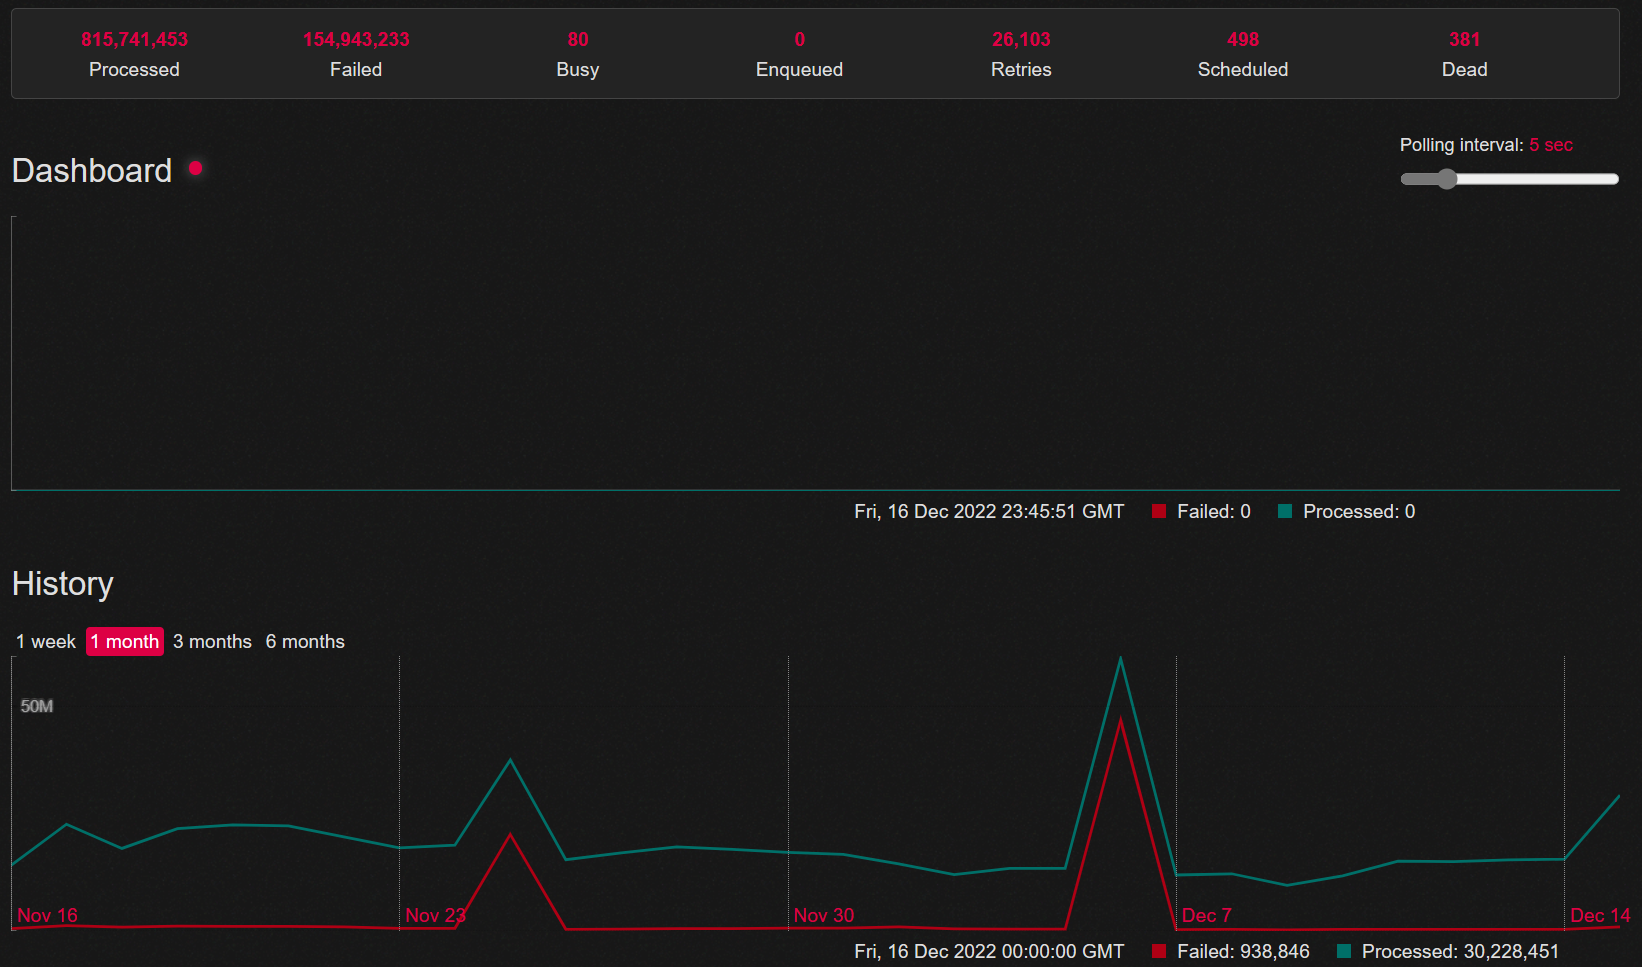
@jerry that failure count 🥺

