
Follow

@falgsc I can see someone here doesnt understand the first thing about judging ethically represented data. You really should try to understand the data you post.
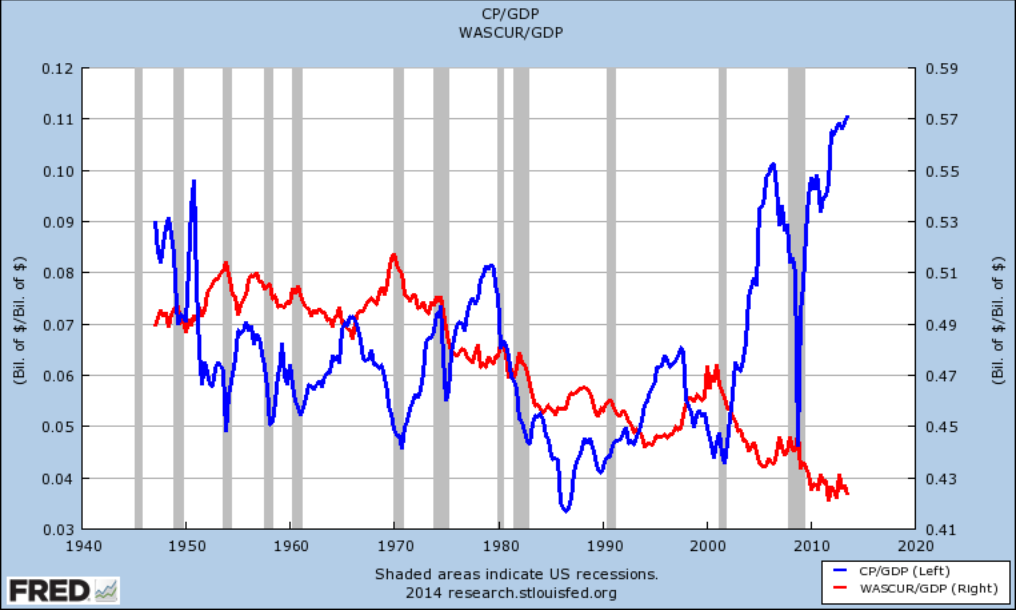
Hint: notice how the scale of the axis on the right is x2 that of the axis on the left and neither axis starts at 0? All the red flags and sirens should be going off the second you see that. It is how you know the data is being unethically represented.
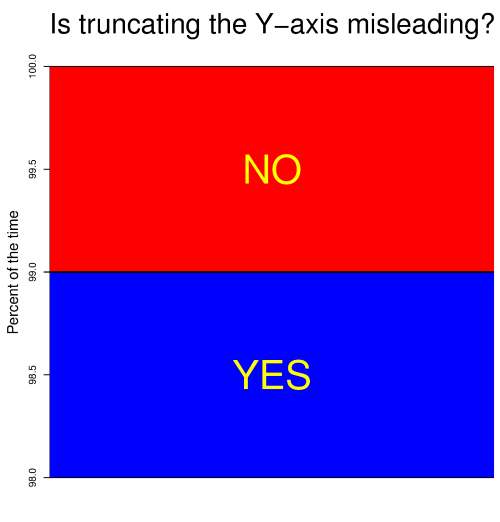
Here is an image to demonstrate in simple terms.
Mind you I'm not saying the general conclusion is wrong. Only that this chart does not accurately represent a comparison between these two values.
