
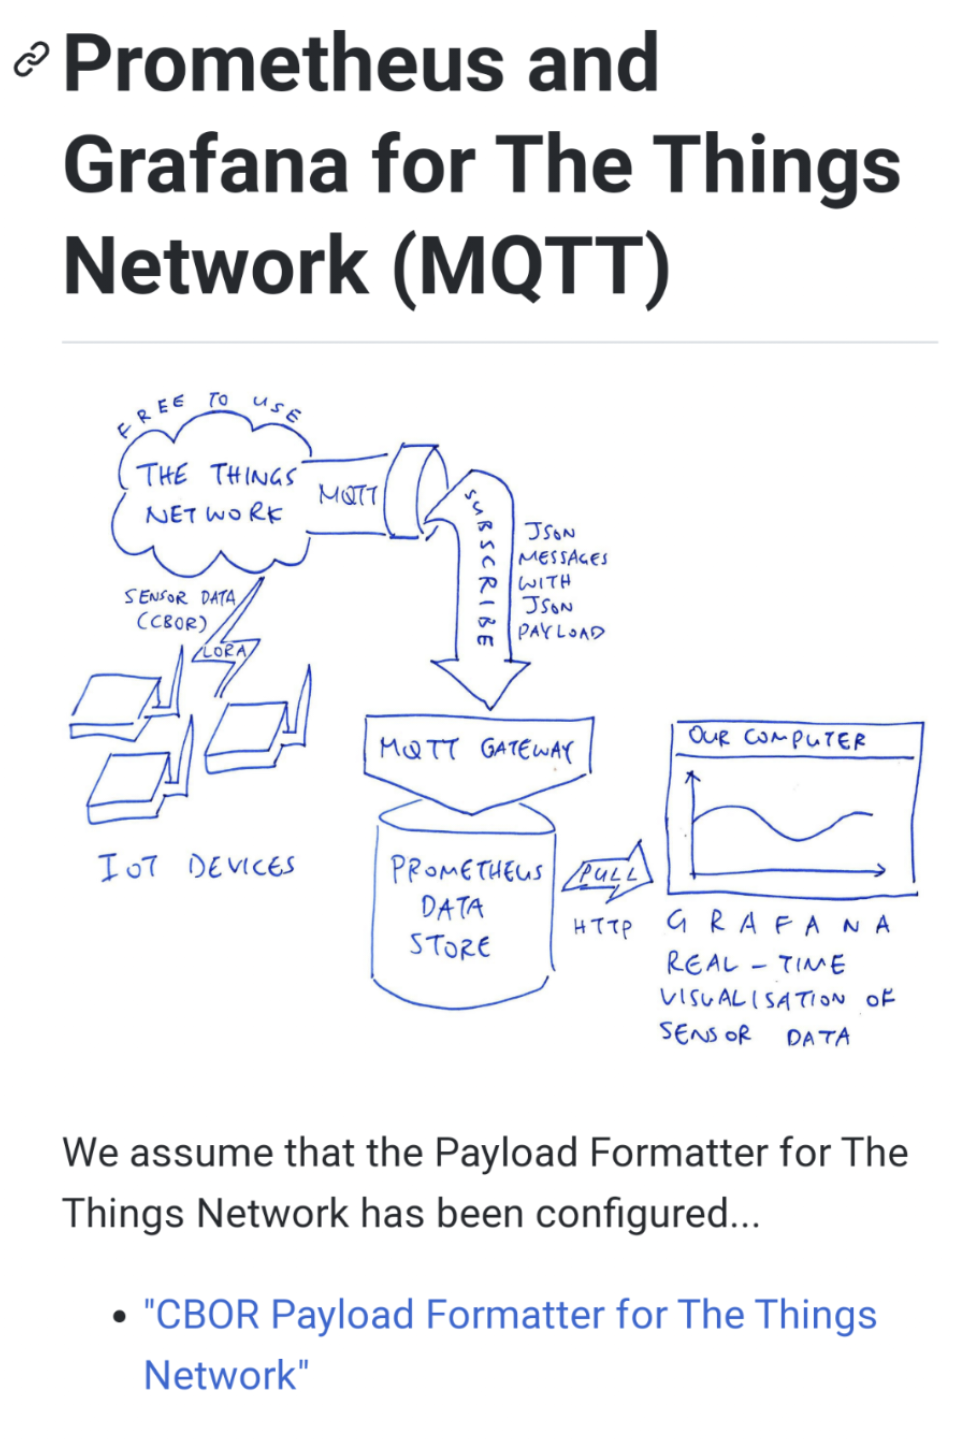
Let's monitor our #IoT Devices in #TheThingsNetwork ... With Prometheus and Grafana
#Prometheus is an open source Time Series Database that works well for storing and querying #IoT Sensor Data
We'll use open source #Grafana to visualise the #IoT Sensor Data stored in #Prometheus
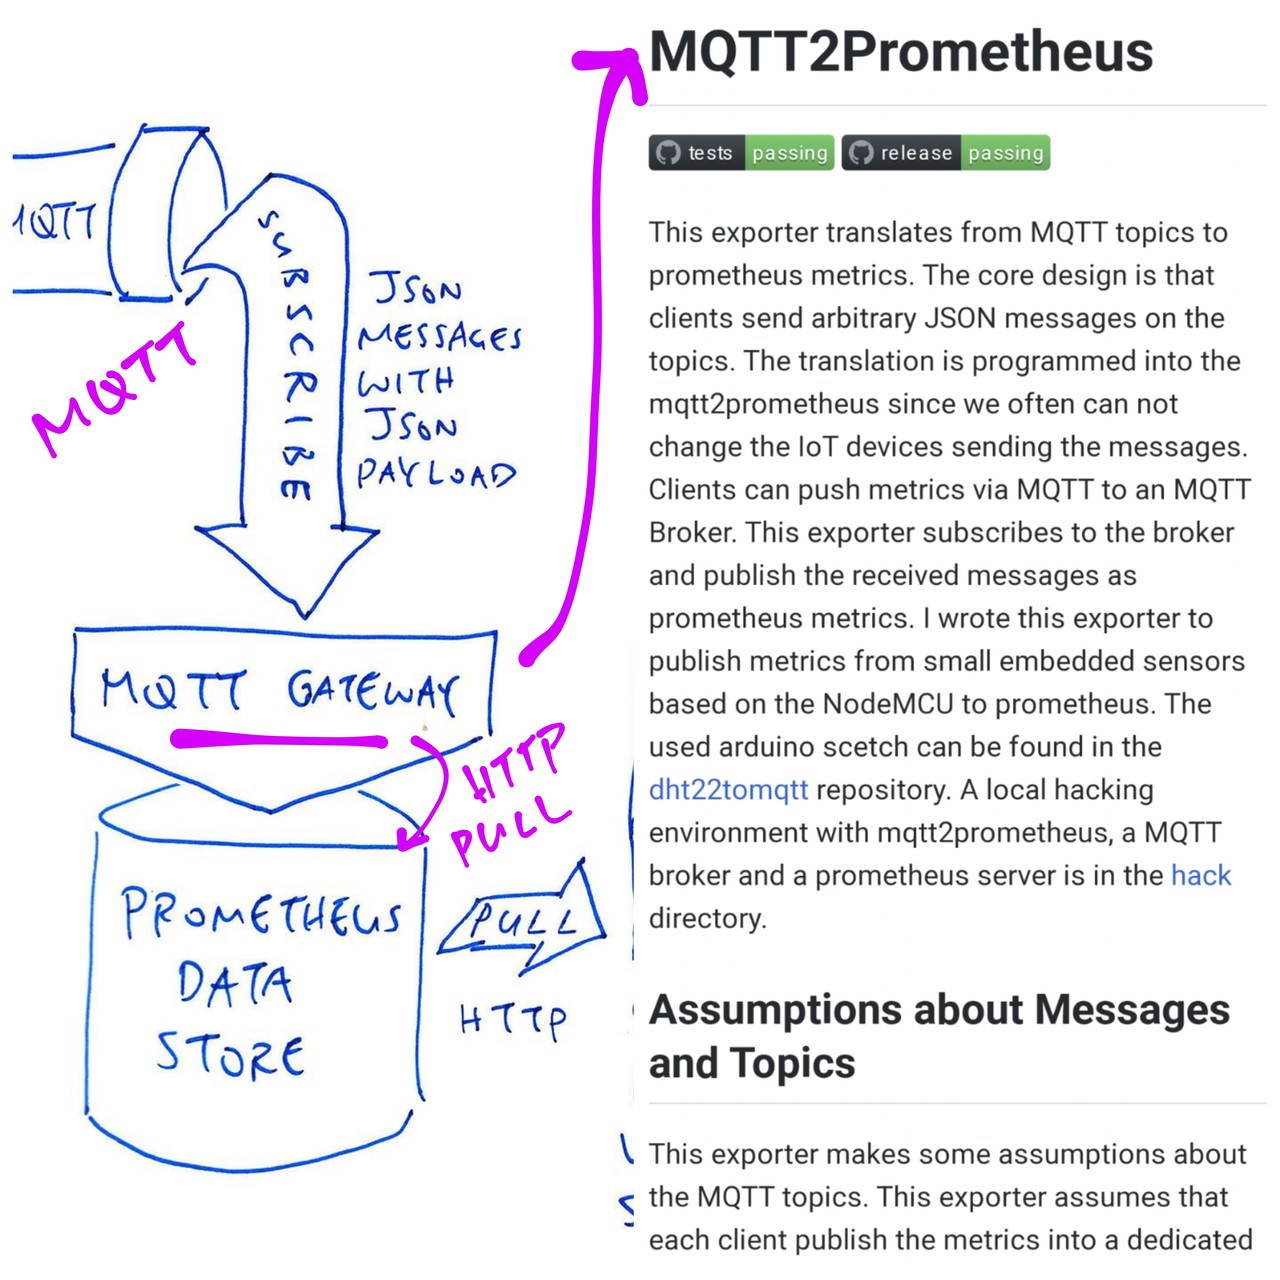
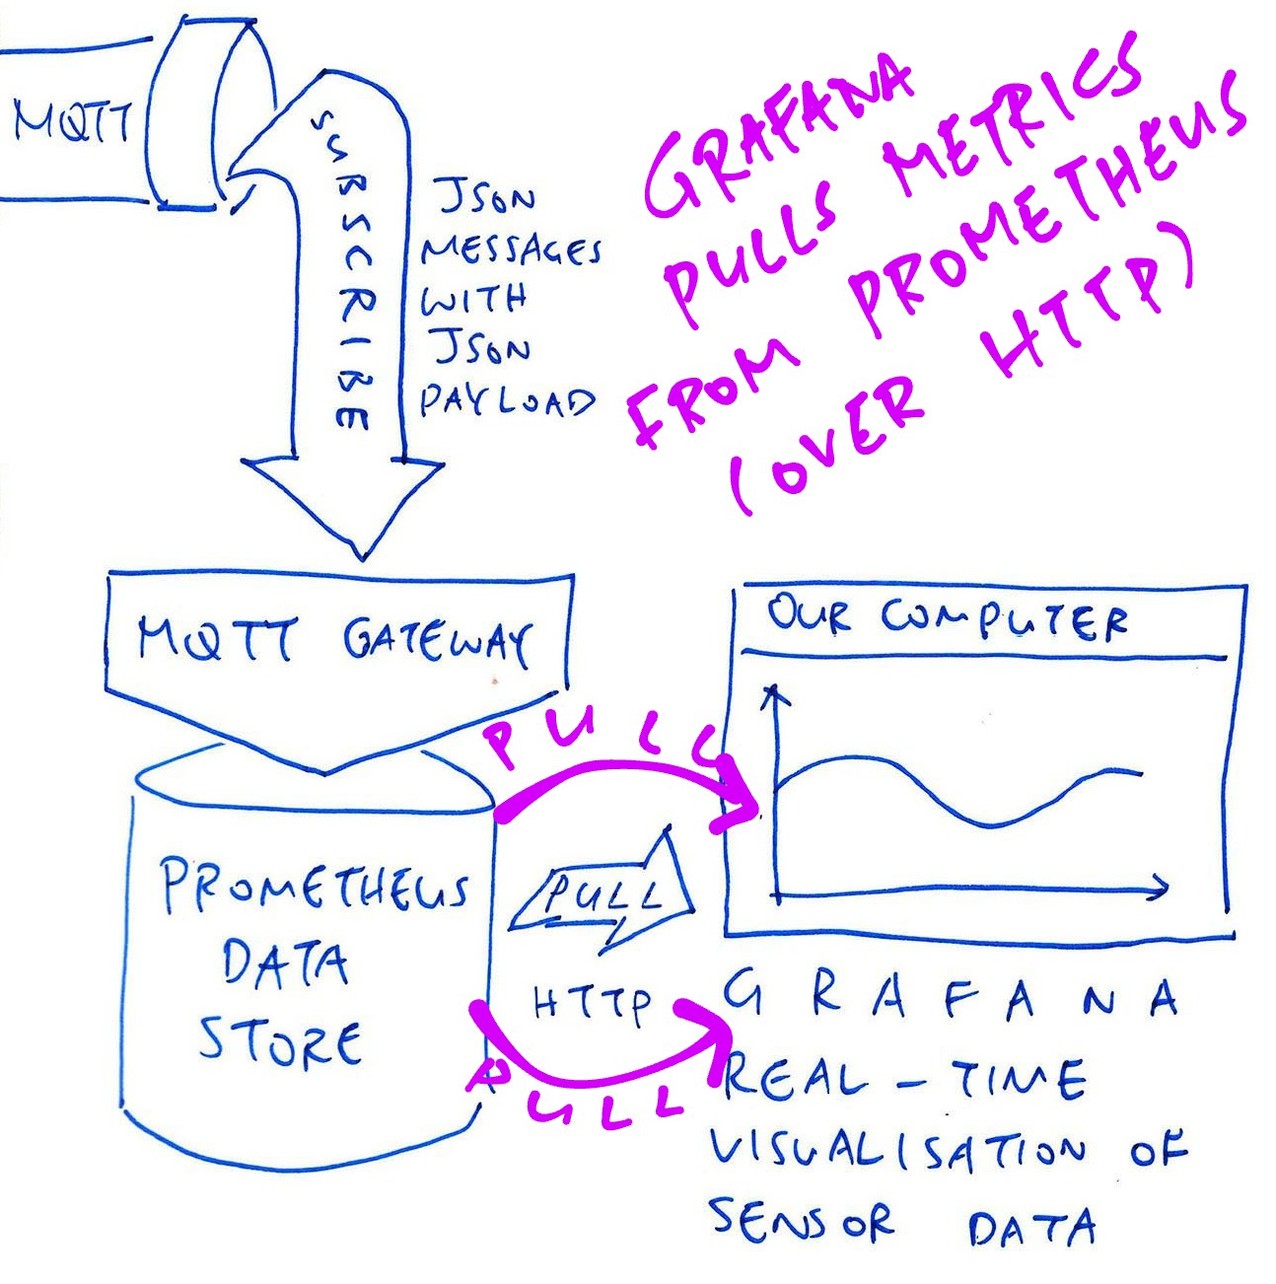
#Prometheus needs an MQTT Gateway to ingest Sensor Data from #TheThingsNetwork ... We'll use MQTT2Prometheus
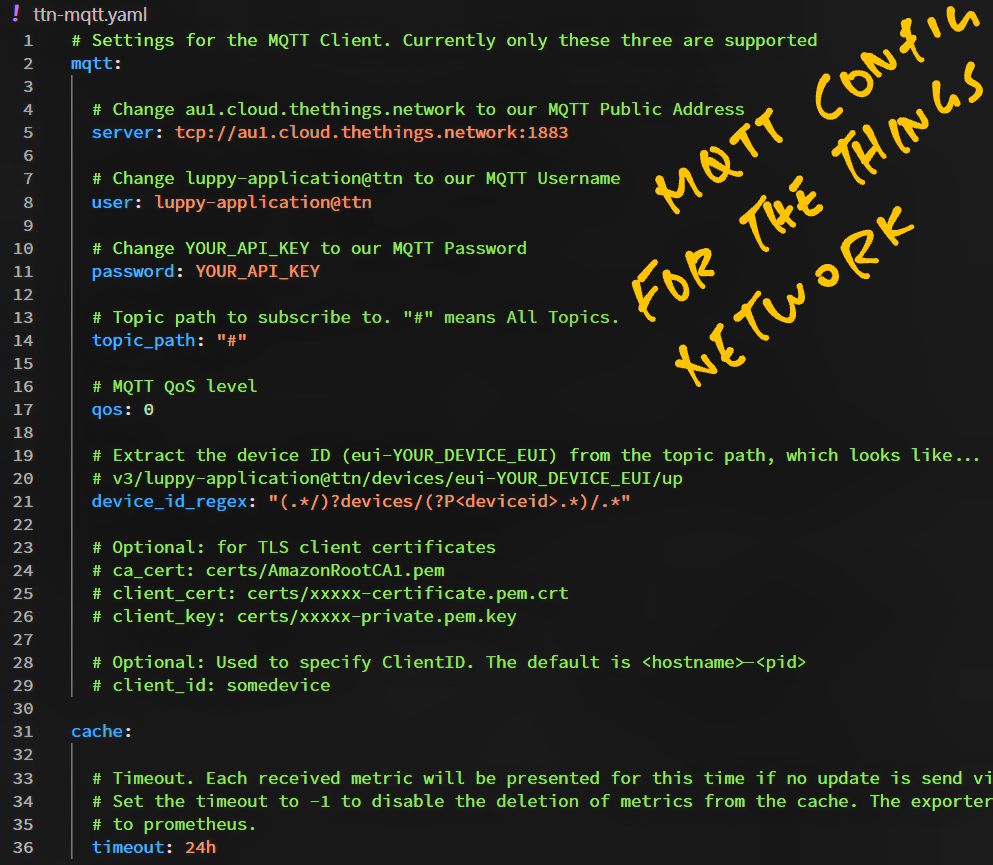
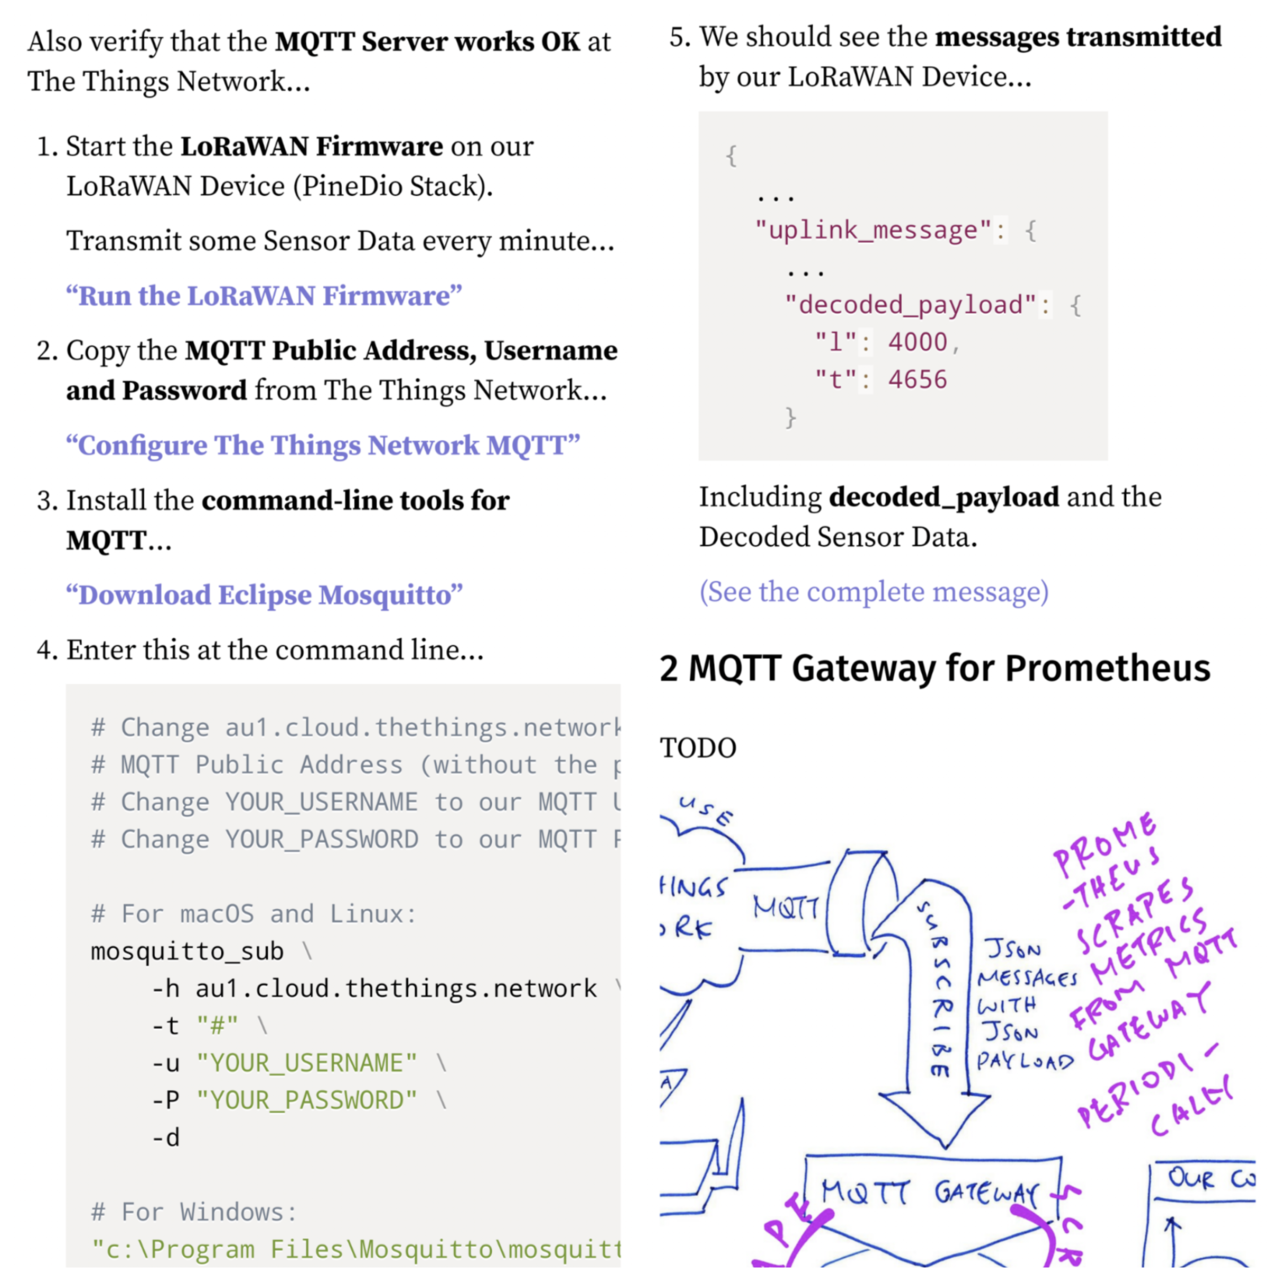
In MQTT2Prometheus Config we specify the MQTT Server Settings for #TheThingsNetwork
https://github.com/lupyuen/prometheus-the-things-network/blob/main/ttn-mqtt.yaml
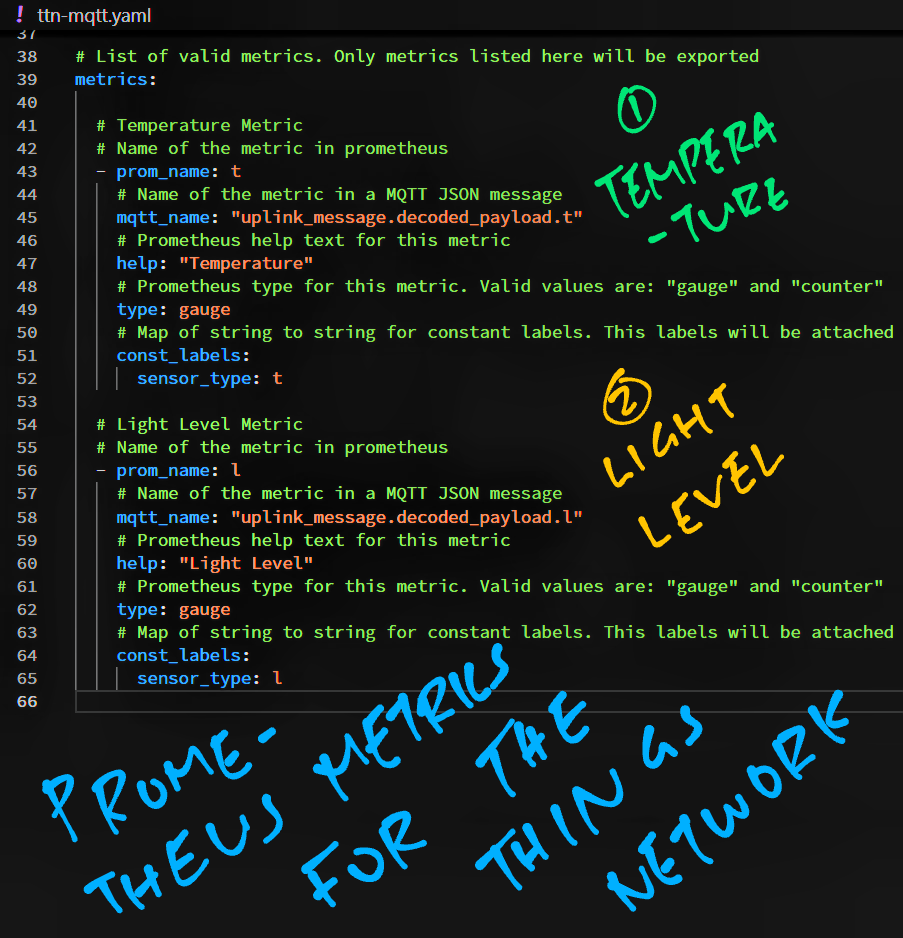
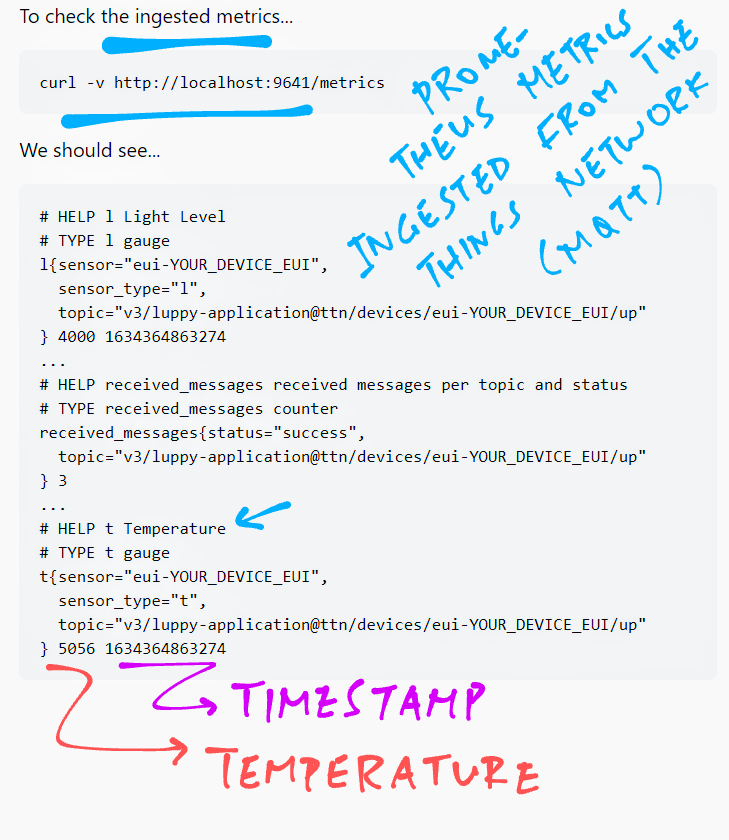
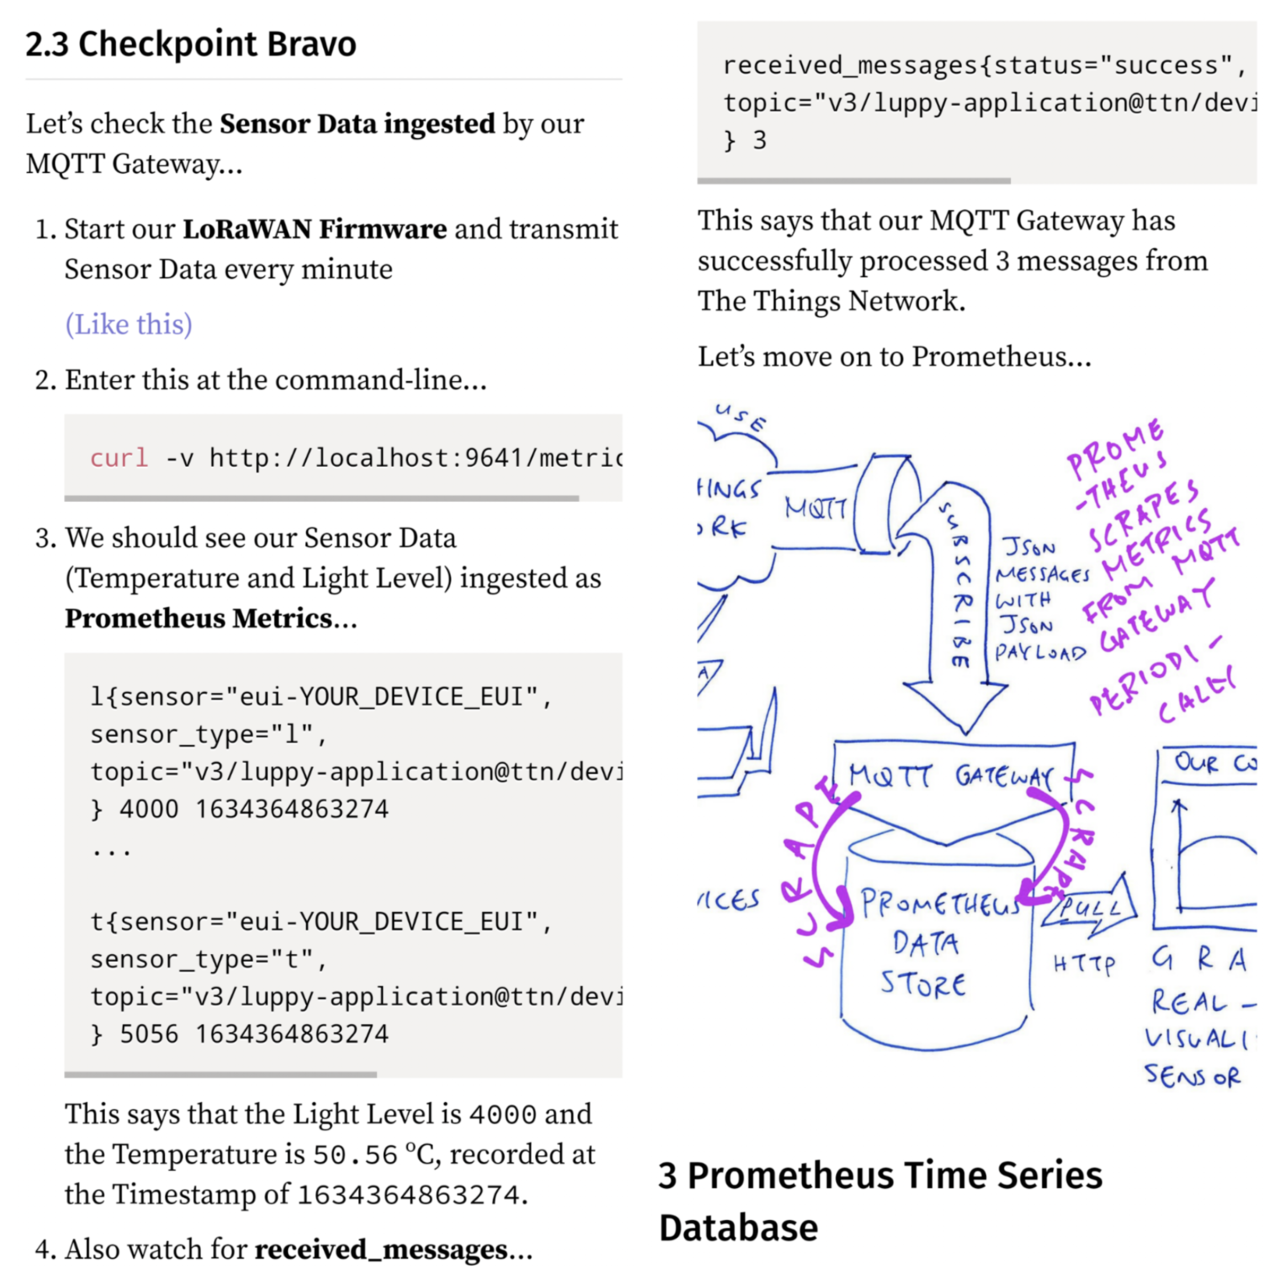
We'll ingest these Sensor Values from #TheThingsNetwork as #Prometheus Metrics
https://github.com/lupyuen/prometheus-the-things-network/blob/main/ttn-mqtt.yaml#L38-L65
MQTT2Prometheus shall ingest these #Prometheus Metrics from #TheThingsNetwork over MQTT
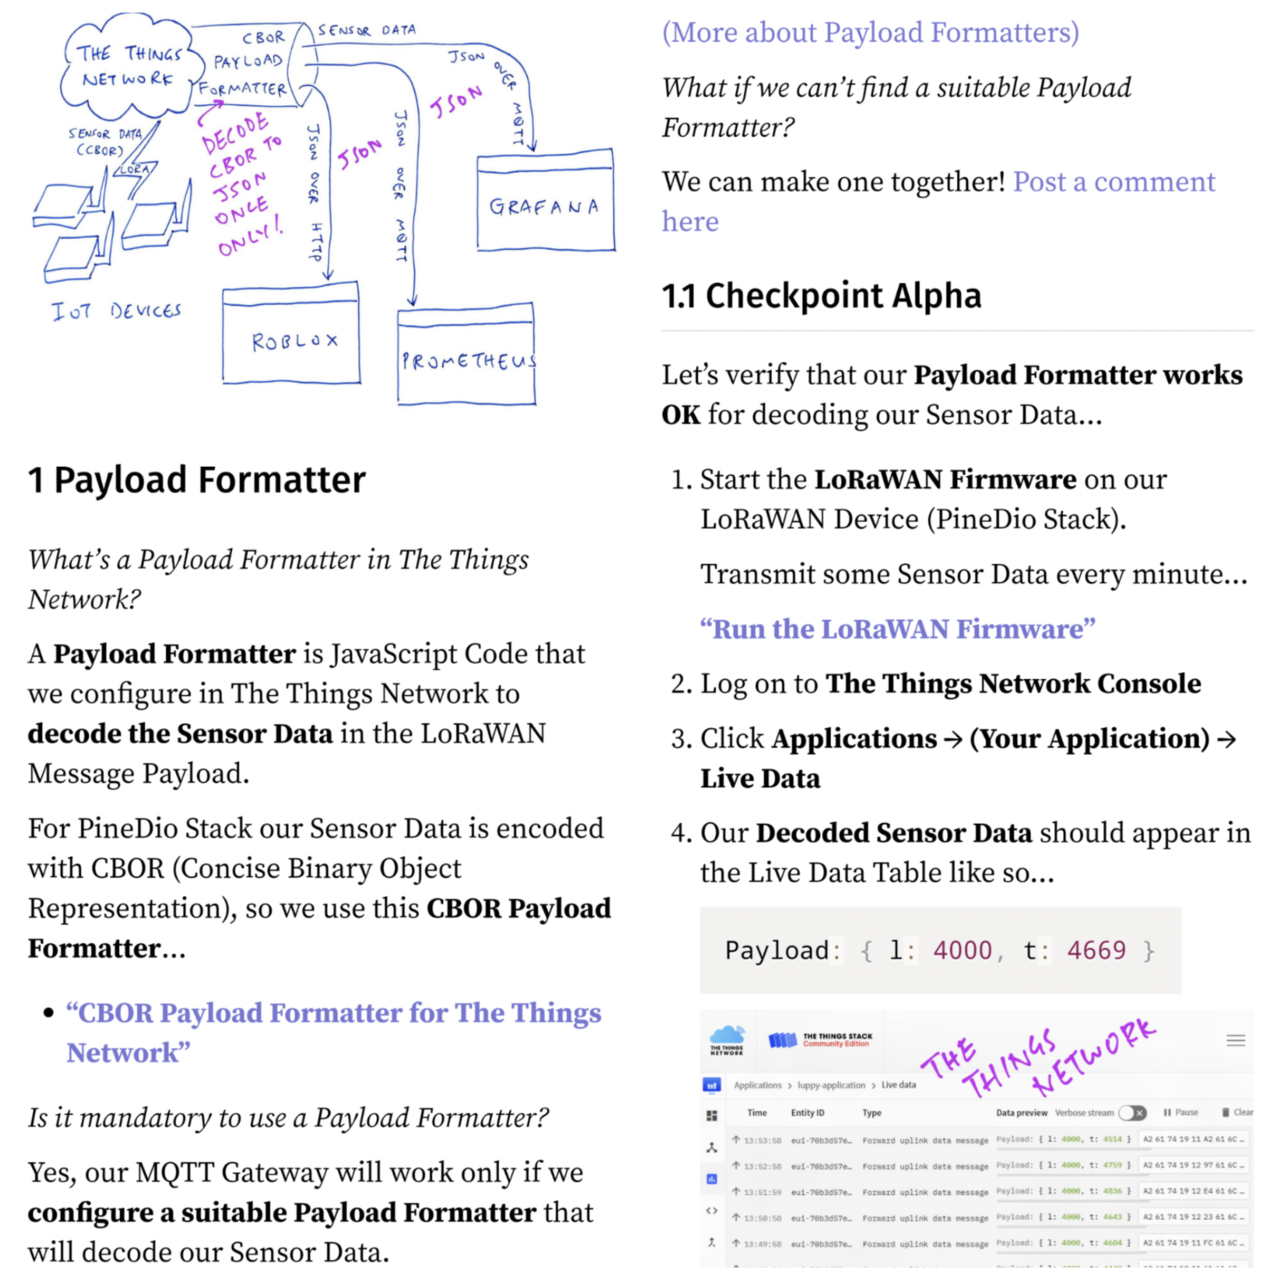
MQTT2Prometheus works with #TheThingsNetwork because we have decoded our Message Payload with a Payload Formatter
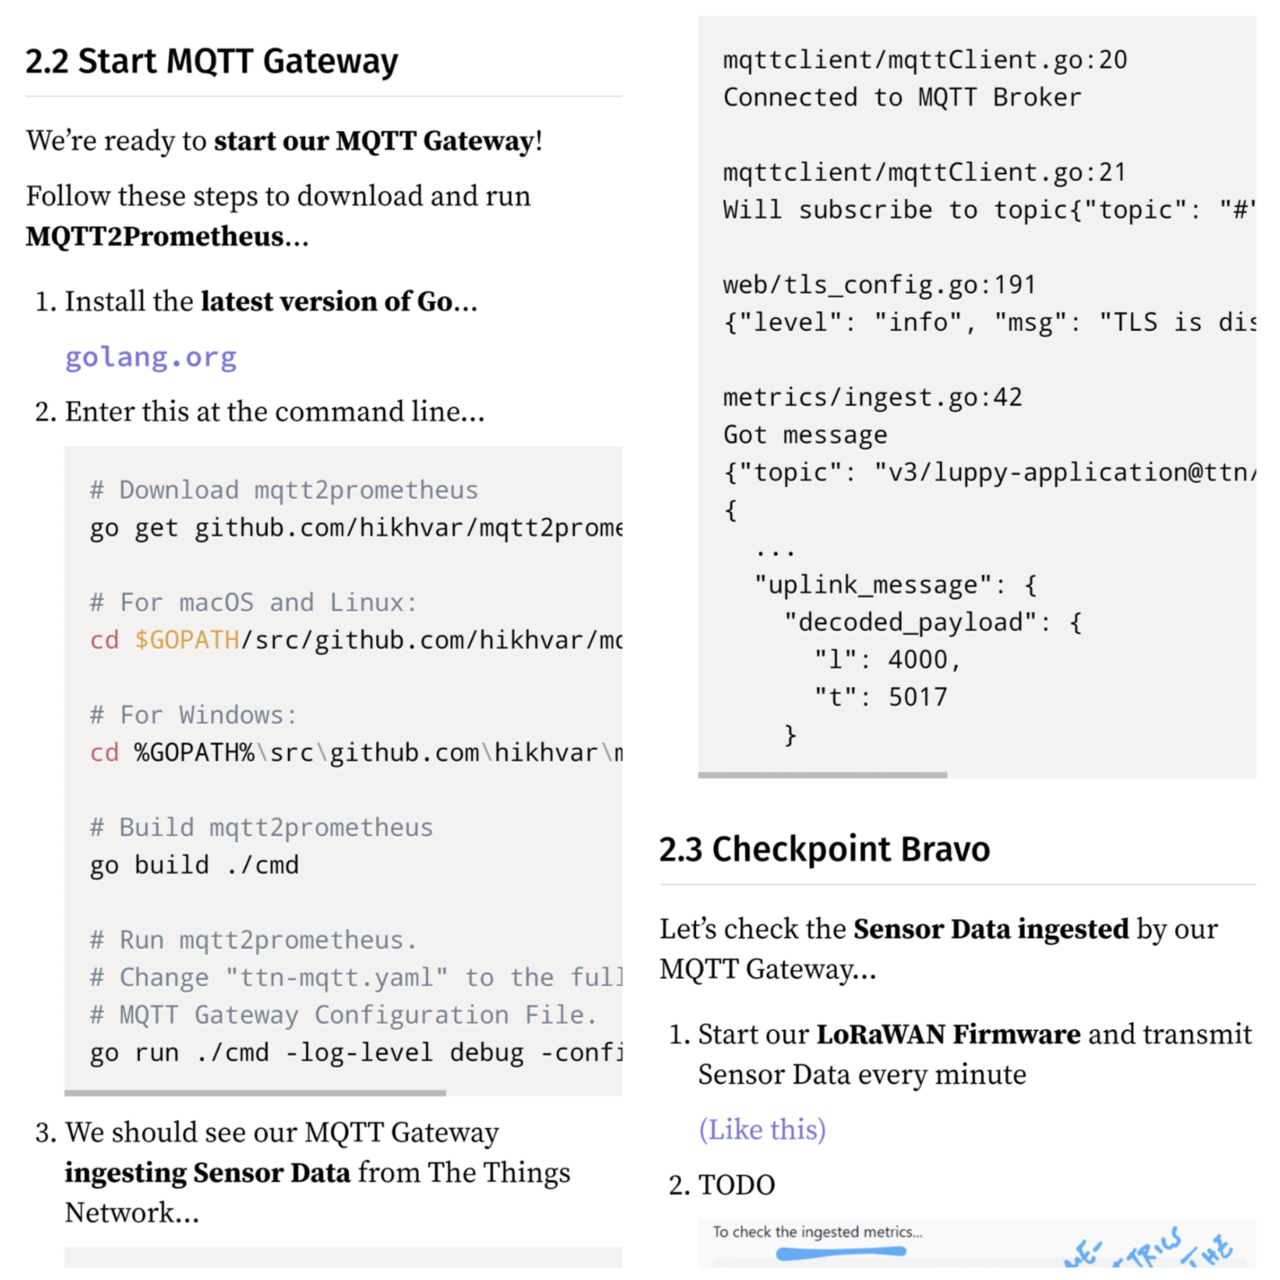
Follow these steps to run MQTT2Prometheus and ingest #TheThingsNetwork Sensor Data as #Prometheus Metrics
Run "curl" to check the #Prometheus Metrics ingested by MQTT2Prometheus from #TheThingsNetwork
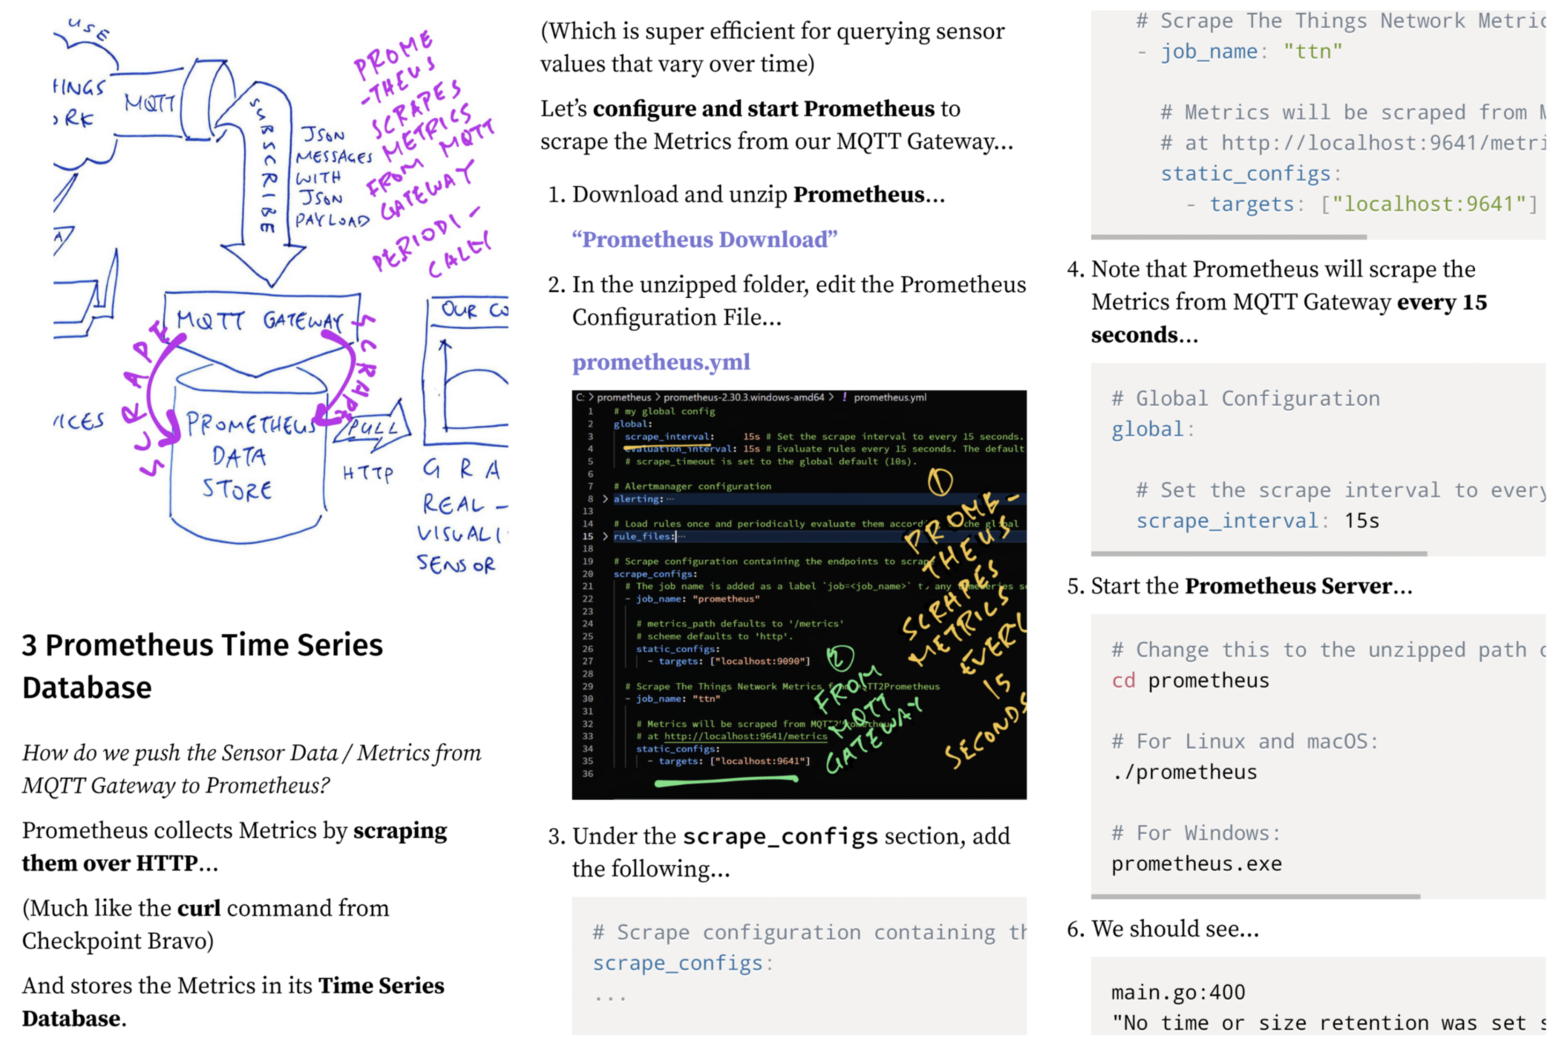
Now we configure #Prometheus to scrape the metrics from MQTT2Prometheus
https://github.com/lupyuen/prometheus-the-things-network#configure-prometheus
Every 15 seconds #Prometheus will scrape the metrics from MQTT2Prometheus (via HTTP)
https://github.com/lupyuen/prometheus-the-things-network#configure-prometheus
To check the scraped metrics in #Prometheus, browse to localhost:9090 and enter the Metric Name (t)
https://github.com/lupyuen/prometheus-the-things-network#configure-prometheus
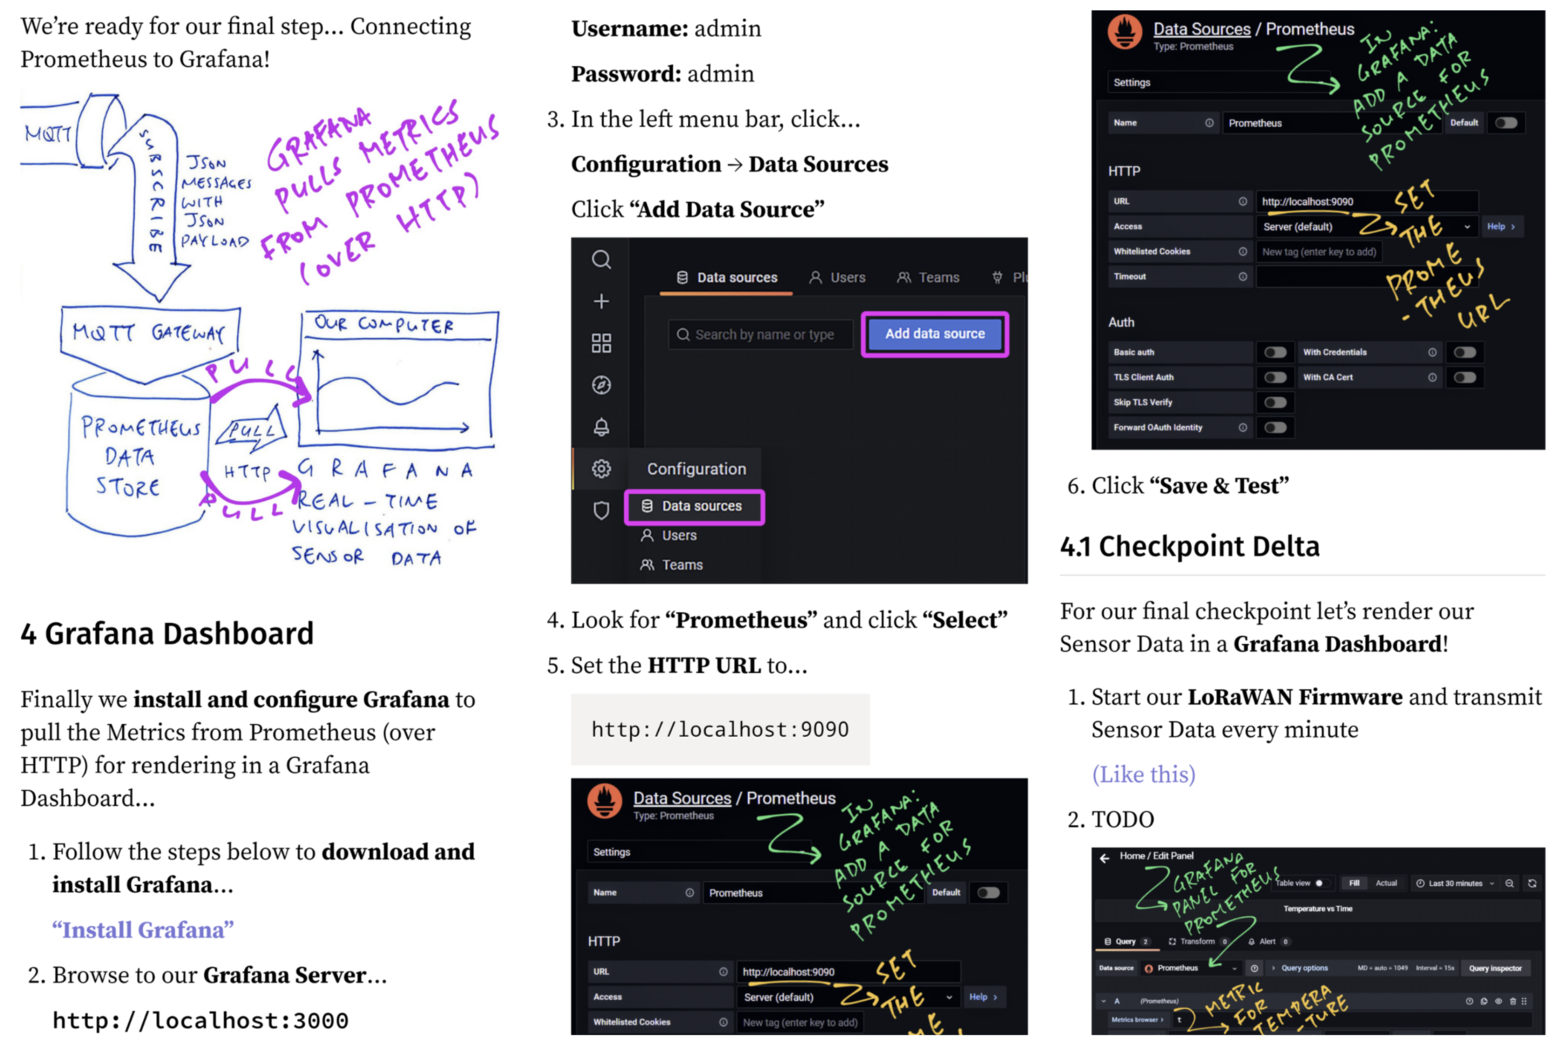
We're ready to connect #Prometheus to #Grafana ... And render our metrics!
https://github.com/lupyuen/prometheus-the-things-network#configure-grafana
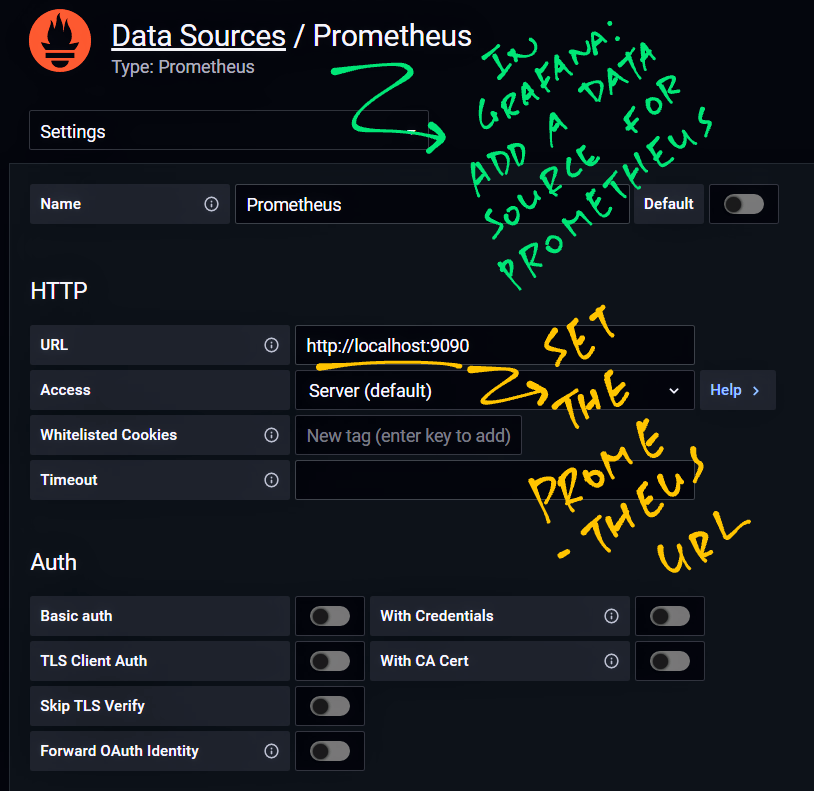
Head over to #Grafana and add a Data Source for #Prometheus (localhost:9090)
https://github.com/lupyuen/prometheus-the-things-network#configure-grafana
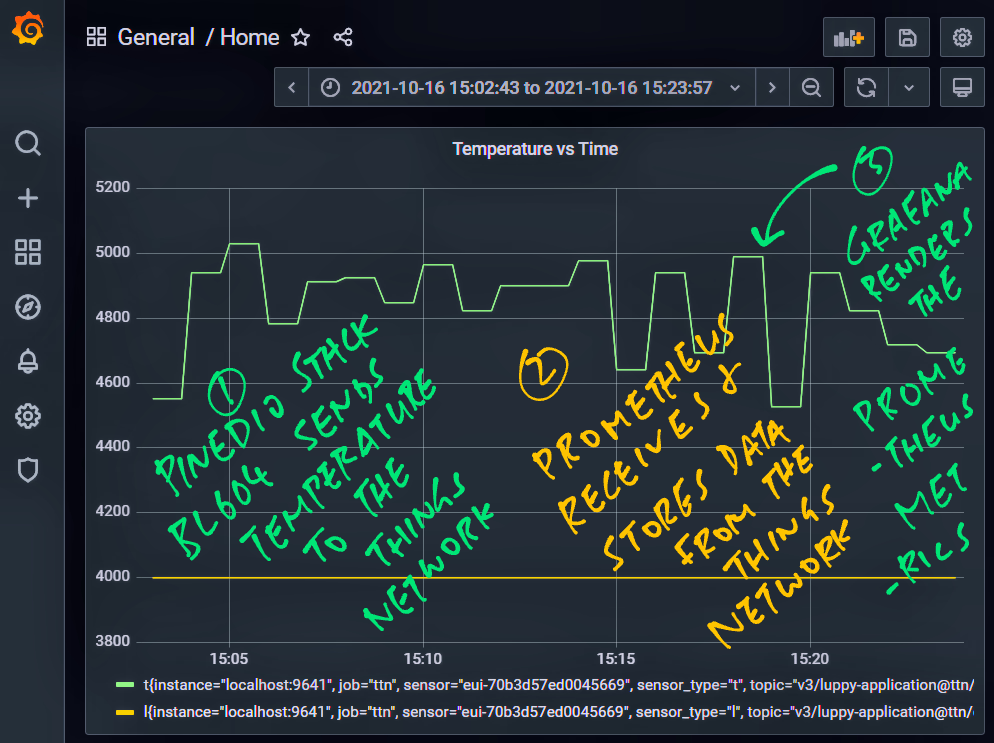
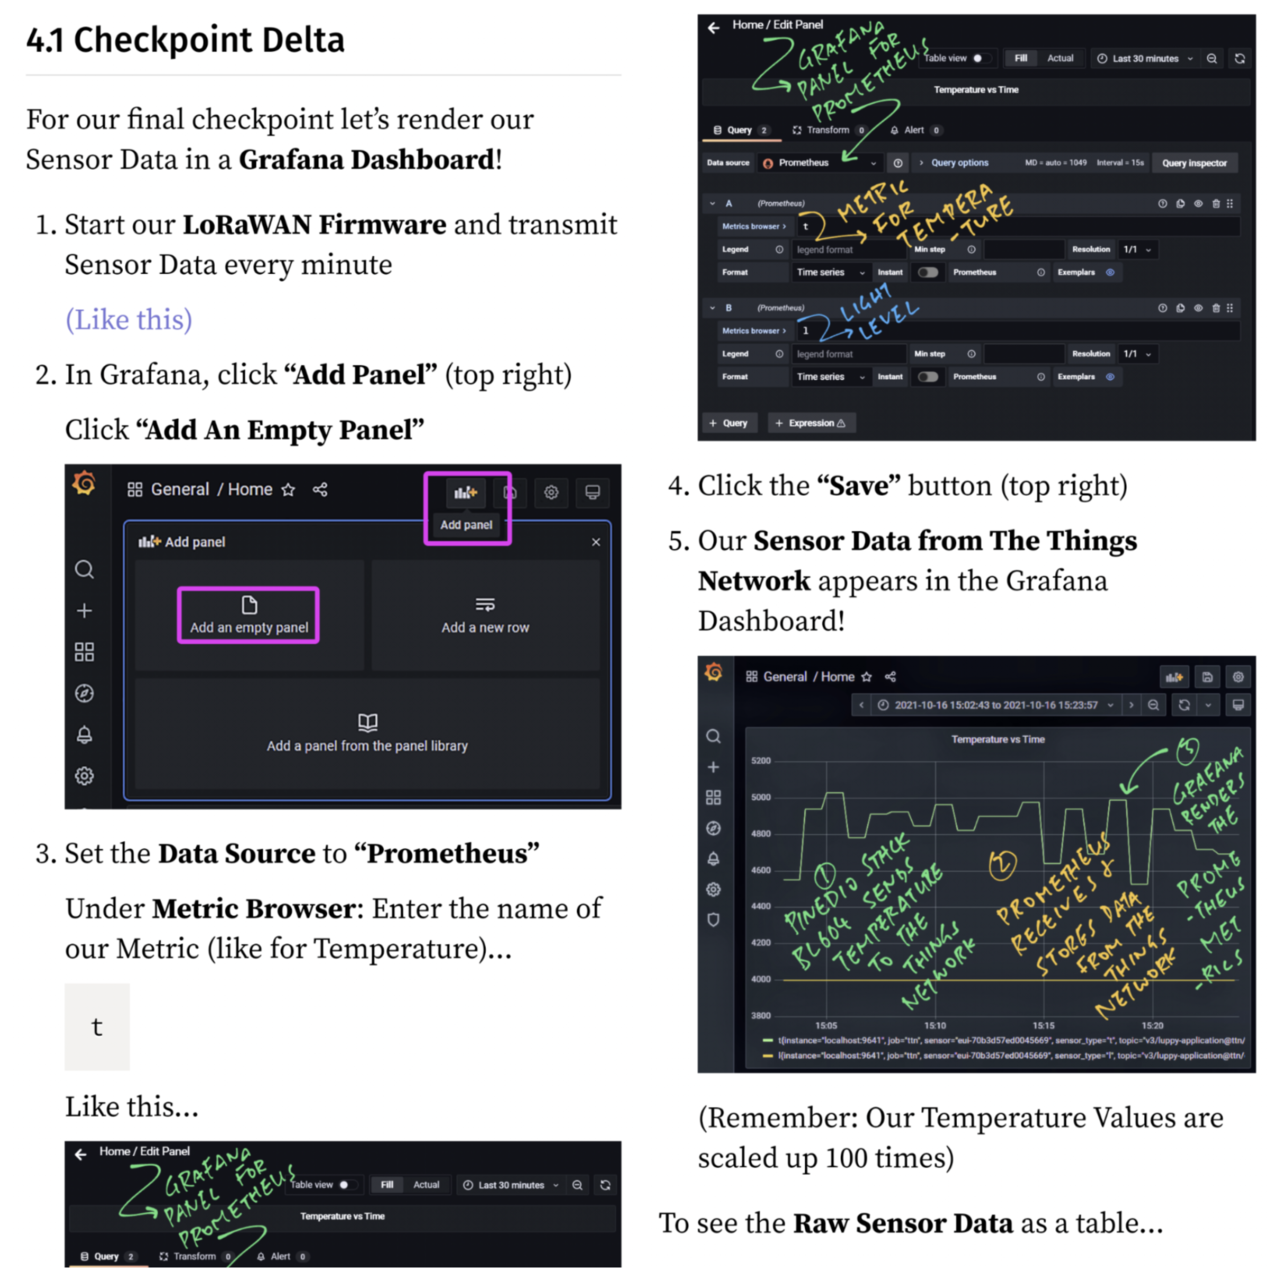
In #Grafana, add a Panel, set the Data Source to #Prometheus and enter the Metric Name (t)
https://github.com/lupyuen/prometheus-the-things-network#configure-grafana
#TheThingsNetwork Sensor Data appears in #Grafana Dashboard ... Thanks to #Prometheus! 🎉
https://github.com/lupyuen/prometheus-the-things-network#configure-grafana
For security, we should connect #Prometheus to #TheThingsNetwork MQTT with TLS Encryption ... Here's how
https://github.com/lupyuen/prometheus-the-things-network#mqtt-with-tls
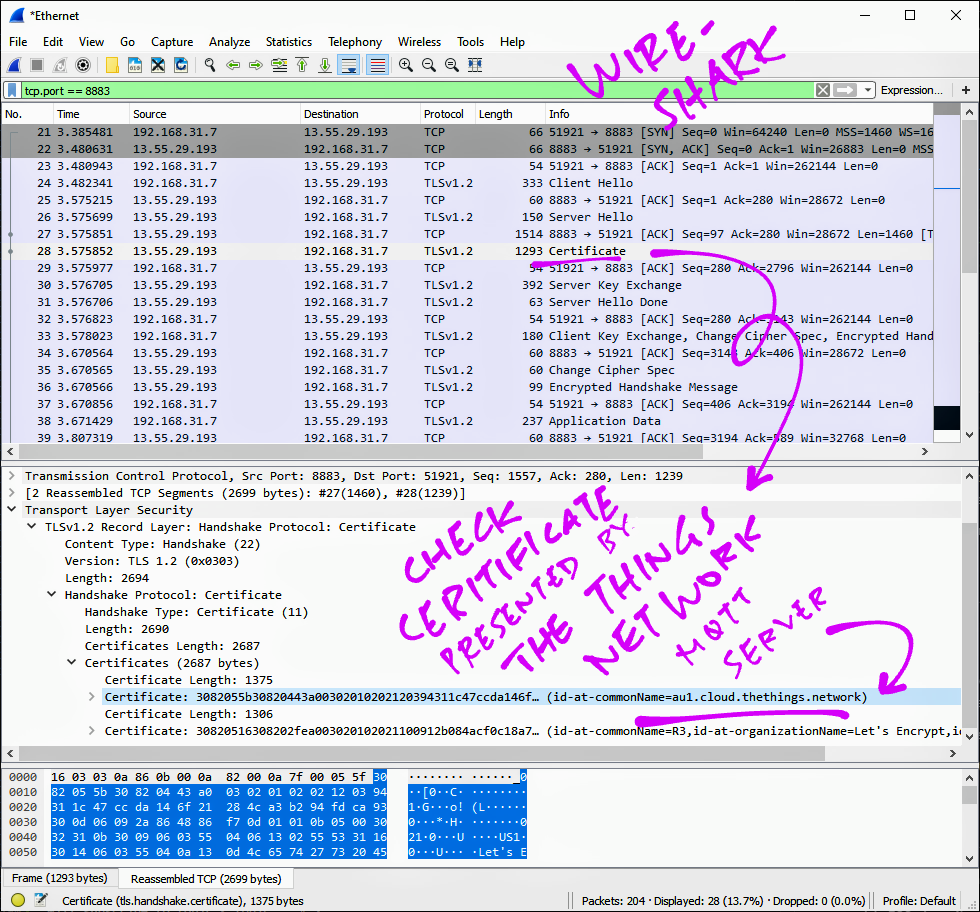
In case of TLS Problems with #TheThingsNetwork MQTT ... Wireshark is our best friend!
https://github.com/lupyuen/prometheus-the-things-network#mqtt-with-tls
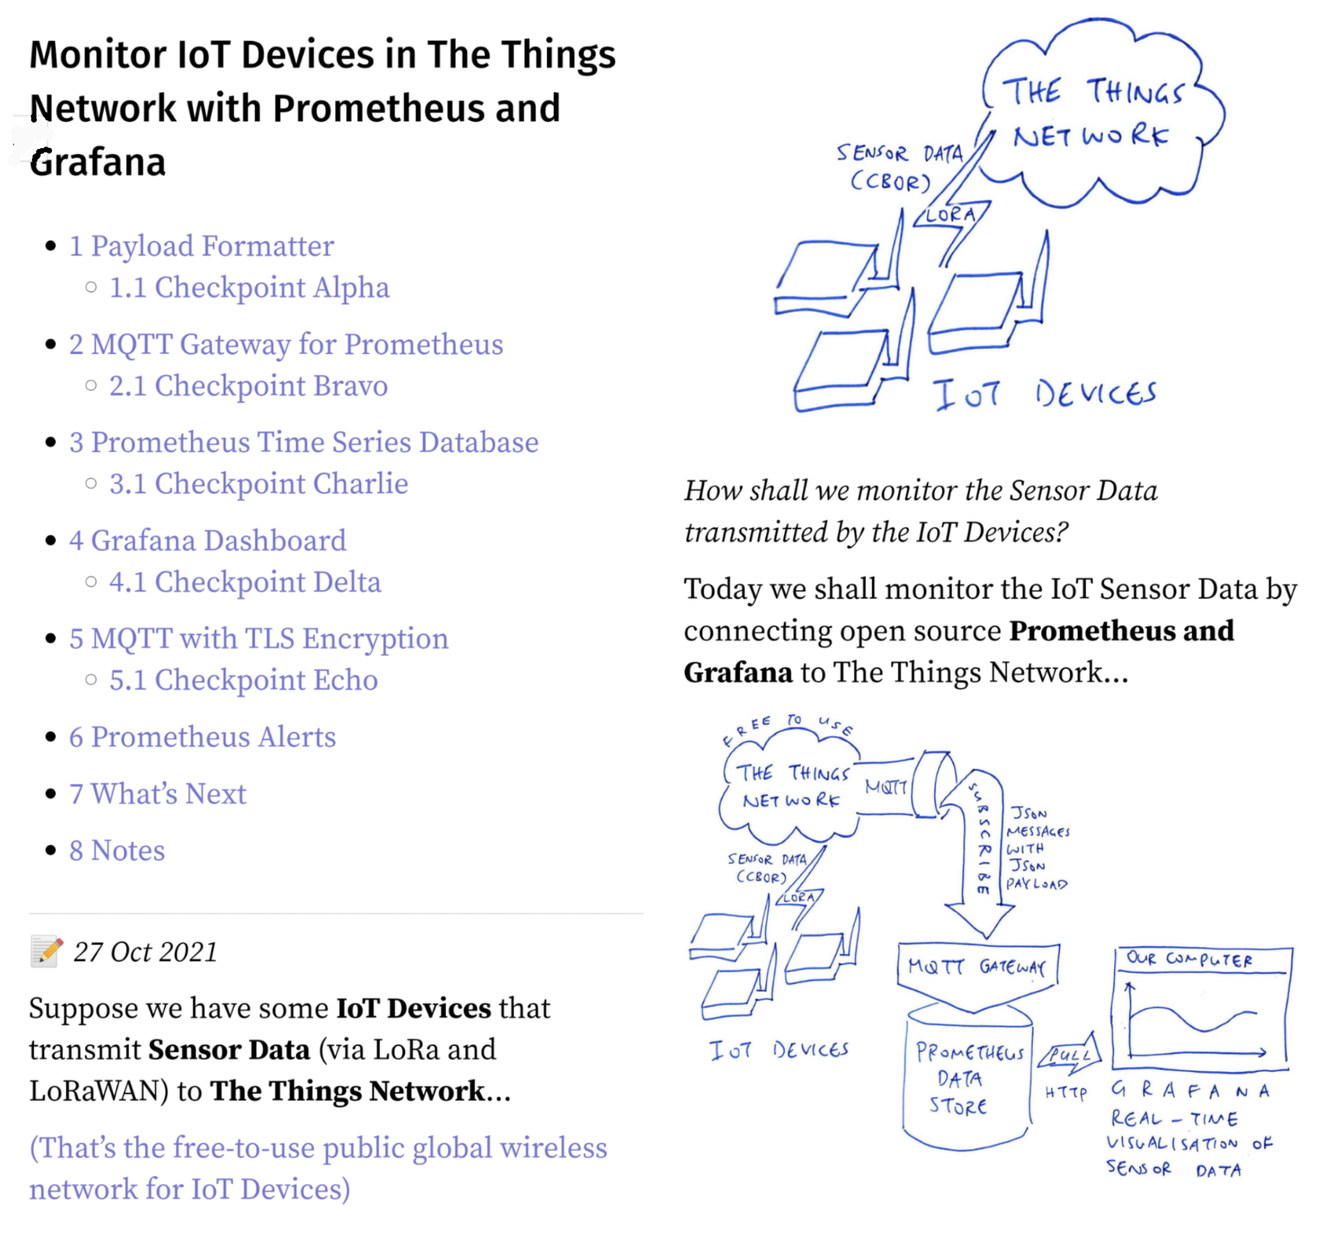
Monitoring our #IoT Devices connected to #TheThingsNetwork ... With #Prometheus and #Grafana ... All shall be explained in this article
How we connect #Prometheus and #Grafana to The Things Network
Defining the #Prometheus Metrics for our Sensor Data at #TheThingsNetwork
https://lupyuen.github.io/articles/prometheus?6#prometheus-metrics
How we install and run #MQTT Gateway for #Prometheus
https://lupyuen.github.io/articles/prometheus?7#start-mqtt-gateway
Configuring #Promethus to scrape metrics from #MQTT Gateway
https://lupyuen.github.io/articles/prometheus?9#prometheus-time-series-database
Checking #Prometheus for the Metrics scraped from #MQTT Gateway
https://lupyuen.github.io/articles/prometheus?10#checkpoint-charlie
How we configure #Grafana to pull Metrics from #Prometheus for rendering
https://lupyuen.github.io/articles/prometheus?11#grafana-dashboard
Rendering Sensor Data from #TheThingsNetwork in a #Grafana Dashboard
https://lupyuen.github.io/articles/prometheus?12#checkpoint-delta
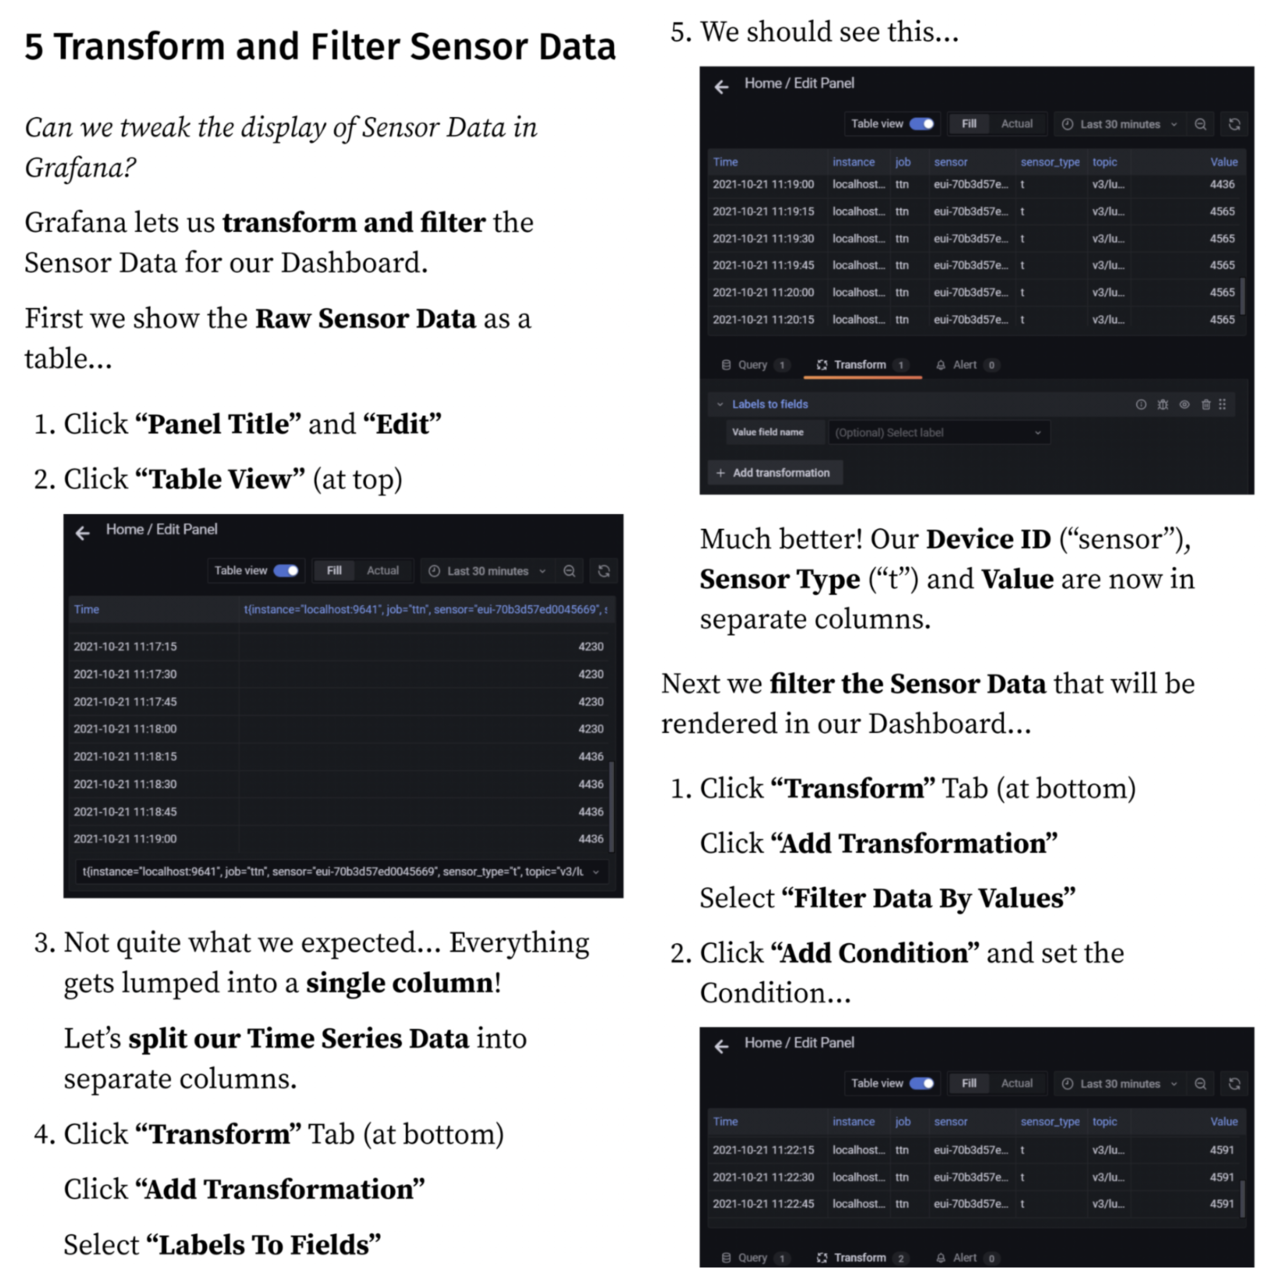
Transforming and Filtering our Sensor Data in #Grafana
https://lupyuen.github.io/articles/prometheus?15#transform-and-filter-sensor-data
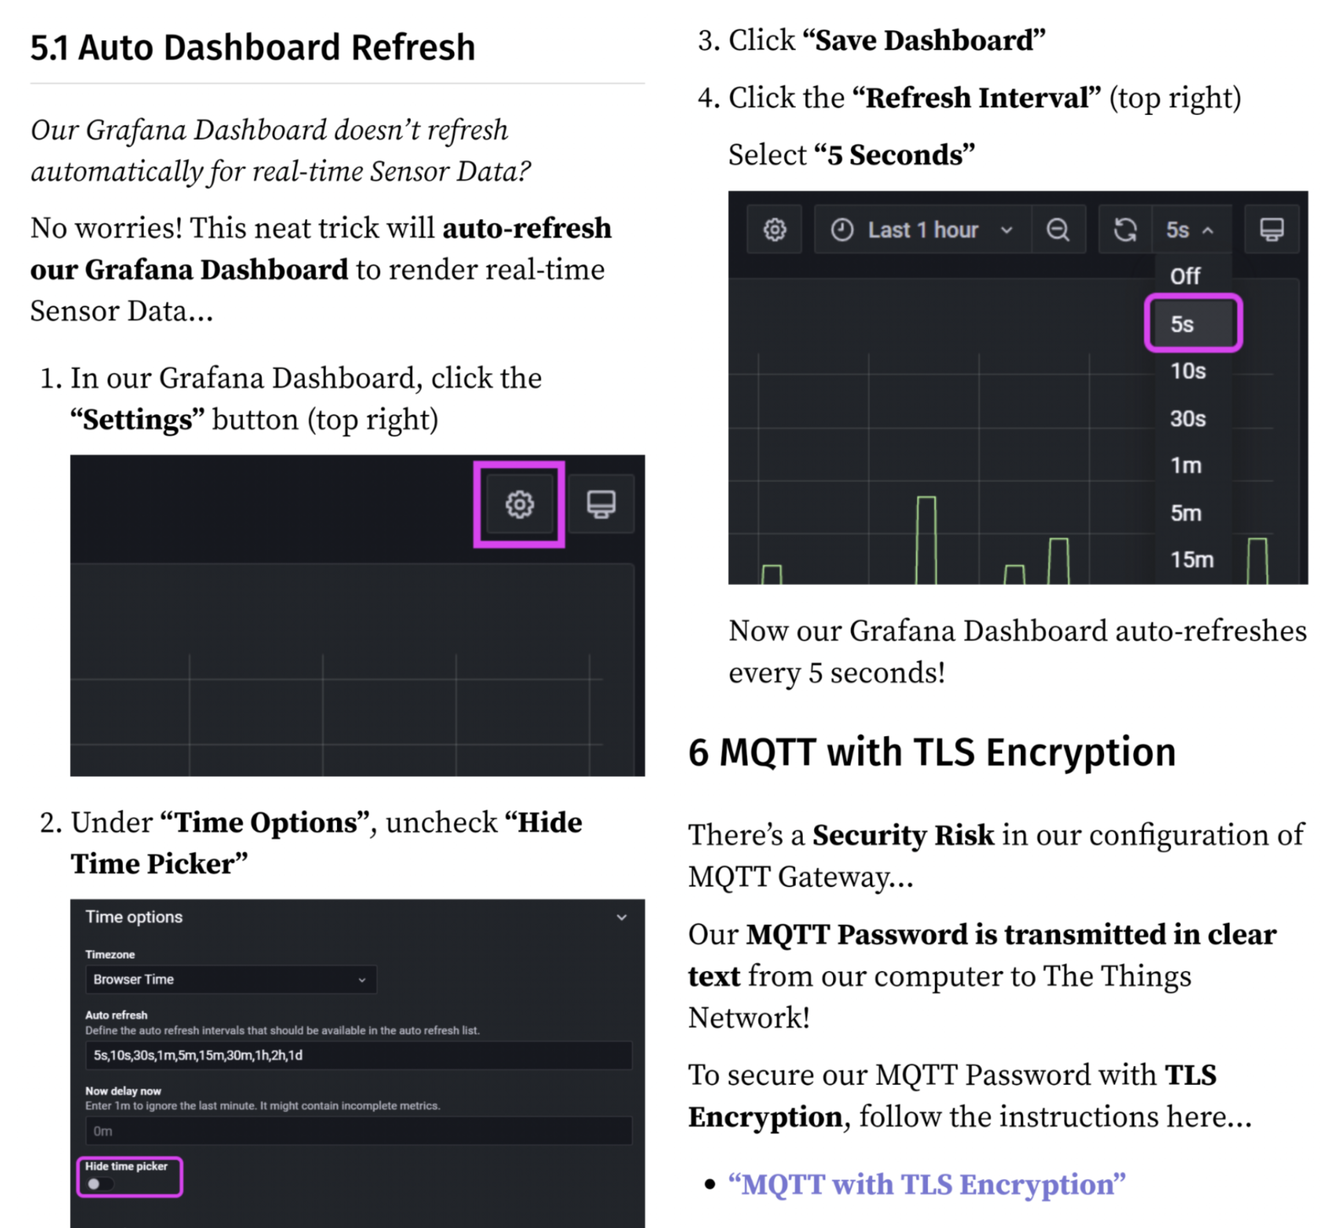
Auto Refreshing our #Grafana Dashboard ... To render real-time Sensor Data from #TheThingsNetwork
https://lupyuen.github.io/articles/prometheus?16#auto-dashboard-refresh
Securing our MQTT Connection from #Prometheus to #TheThingsNetwork ... With TLS Encryption
https://lupyuen.github.io/articles/prometheus?17#mqtt-with-tls-encryption
Creating Monitoring Alerts on Sensor Data with #Prometheus
https://lupyuen.github.io/articles/prometheus?18#sensor-data-alerts
What's next for #PineDio Stack BL604, #LoRaWAN and #TheThingsNetwork
Here's how we monitor our #IoT Devices connected to #TheThingsNetwork ... With #Prometheus Time Series Database and #Grafana Dashboards

Configuring the #MQTT Gateway for #Prometheus and #TheThingsNetwork
https://lupyuen.github.io/articles/prometheus?5#mqtt-gateway-for-prometheus