

Martin Ruskov @mapto@qoto.org
- Games
- https://mapto.itch.io
- Others (+fedi)
- https://linktr.ee/mapto
Studying how people interact, in the past (#CulturalAnalytics) and today (#EdTech #Crowdsourcing). Researcher at @IslabUnimi, University of Milan. Bulgarian activist for legal reform with @pravosadiezv. I use dedicated accounts for different languages.
My profile is searchable with https://www.tootfinder.ch/
Joined Nov 2022
Pinned post
Commercial LLMs keep coming back to Elias Thorne. Who is he? Why lighthouse keepers and clockmakers? Two researchers at Cornell dug in public corpora and found it out.
It turns out an AI generated story from the days of GPT-3.5 got proliferated in something that could be an indication of an early form of model collapse.
https://www.404media.co/elias-thorne-chatbots-llms-chatgpt-lighthouse-keeper-story/
This is not the first case when we see diffusion of strange data.
1/3
Pinned post
I think I now know where to draw the line between "good" and "bad" #GenAI, and possibly (or rather obviously) the same for #machineLearning. It's simply whether the input data has been constructed rigorously. Put this way it's the most obvious statement ever, but somehow #BigTech have convinced us all that they advance research by recklessly scraping #twitter, #4chan and who knows what else (they keep their training data secret).
What is good science in computational linguistics? Well, open data is a step towards it. But open and crap is not a solution. We need to actually _know_ and manage the data. And nobody in their right mind would want to plough through toxic data to clean it. We've all heard the horrors of Kenyan data workers who do it for money and still suffer doing it.
But better (yes, also smaller) corpora are of interest to scholars in the humanities and the social sciences. Think of https://textcreationpartnership.org or https://mlat.uzh.ch. Yes, they are too big for individual researchers or even teams to handle, but we have the organisational and technological infrastructure to work on them collectively. We've been doing it for ages and we will continue doing it. We just need to do it together.
And this is the goal of the European Research Council project proposal I'm submitting in this very moment.
Pinned post
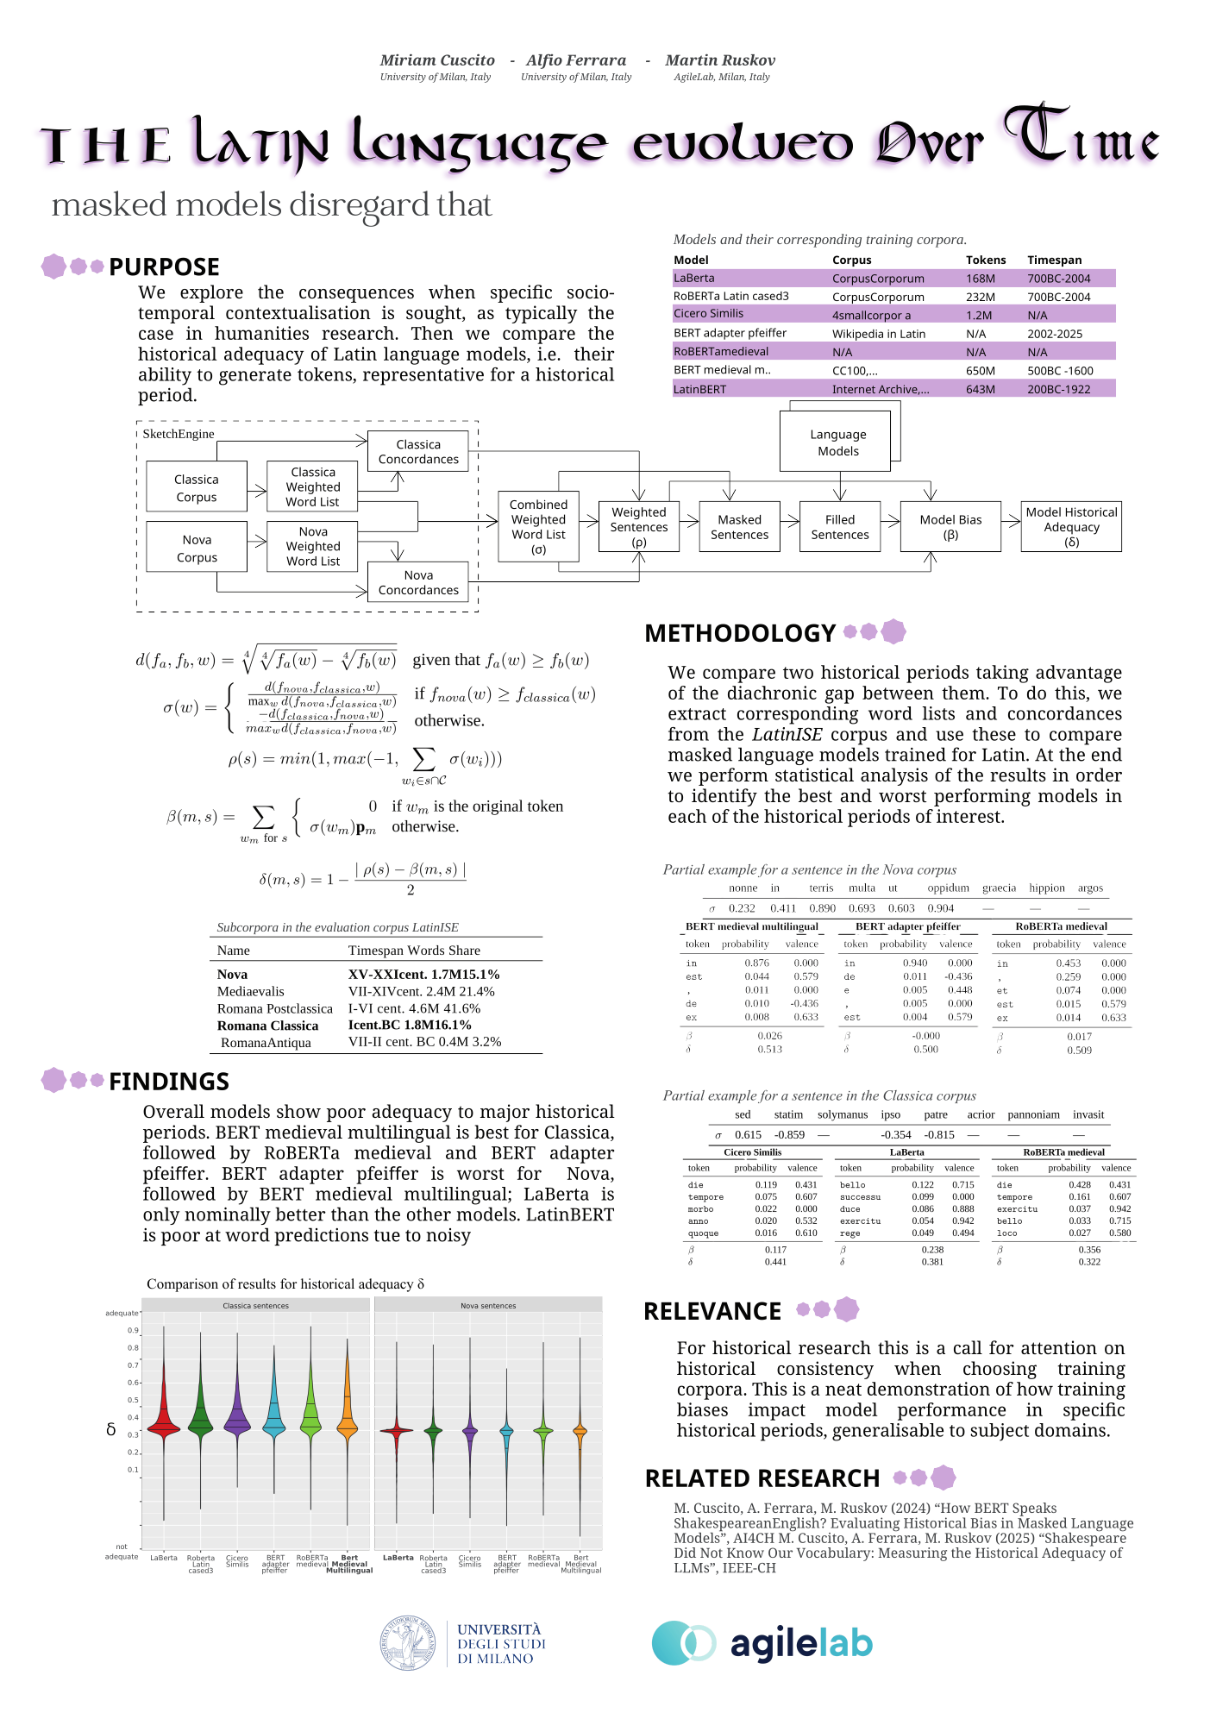
Today at #CHR2025, I will be presenting our work on the evaluation of the historical adequacy of masked language models (MLMs) for #Latin. There are several models like this, and they represent the current state of the art for a number of downstream tasks, like semantic change and text reuse detection. However, a historical researcher, philologist or else would want to be sure that such models really represent the historical period of interest. For example, it would be an embarrasing hallucination if St. Augustine showed up in the context of the Roman senate.
Our evaluation confirms a known problem: LLMs and masked models in particular are trained on corpora without attention to historical periods. Unlike other research we've done on Early Modern English, this problem leads to models being barely distinguishable when it comes to their ability to generate based on a historical period. Even though history is a case where it is most obvious when models go wrong, this type of contamination is a known problem for LLM training overall, think of different legal jurisdictions using the same language, dialects in programming languages, etc.
This research was generously supported by AgileLab.
The full paper is available at:
https://anthology.ach.org/volumes/vol0003/the-latin-language-evolved-over-time-masked-models/
Pinned post
Our paper on the values found in fairy tales from some European countries has been published. We studied how values are explicitly present in tales from Germany, Italy and Portugal using various NLP techniques, but most notably Word2Vec and Word Embedding with a Compass. We visualise synchronic semantic variation to show certain differences based on observations of the corpus, some of them already observed in previous literature. A discussed example in our findings is how motherhood in Germany is strongly related to generosity, whereas in Italy and Portugal it has stronger relationship to wisdom.
Fulltext available at: https://aclanthology.org/2023.nlp4dh-1.8/
Pinned post
In the morning session today Sara Sullam and I will be presenting our work on exploring nominal (in our case study - bibliographical) data. We do it by borrowing a method from educational research - the notion of phenomenographic variation. #CHR2023🧵
Martin Ruskov
boosted

Here’s a sample. Since I was just at an ICML workshop about the importance of fuzzy, context-specific evaluation, I guess I don’t need much convincing on this!
Clearly RAMpocalypse is the precursor to the AIpocalypse, but a there is a strong case to make that demand for RAM will be growing even without AI, not unlike how demand for GPU kept growing even without crypto. We have cars, home appliances, disposable devices all using RAM. Data centers are only the (huge) top of the iceberg.
Martin Ruskov
boosted

"Earlier this year, in written testimony before the U.S. Senate Committee on Commerce, Science, and Transportation, neuroscientist Jared Cooney Horvath said Gen Z is less cognitively capable than previous generations, despite its unprecedented access to technology. He said Gen Z is the first generation in modern history to score lower on standardized tests than the previous one."
1/4
Martin Ruskov
boosted

The Road Home - Shot on the way back to Amarillo, TX on Saturday - eastern Harding County, New Mexico, USA #NewMexico #AmericanWest #spring #nature #landscape #outdoors #road #clouds #cloud #cumulus #Fujifilm #FujifilmXT5 #Tamron #monochrome #blackandwhite
Martin Ruskov
boosted
Supercell thunderstorm moving away, showing its full structure. It was raining on me when I shot this, requiring quick attempts at shooting and many wipes of the lens. (June 23, 2026) - Buffalo Lake National Wildlife Refuge, Texas, USA #Texas #TexasPanhandle #AmericanWest #GreatPlains #summer #nature #landscape #outdoors #road #clouds #supercell #thunderstorm #stormchasing #monochrome #blackandwhite #Fujifilm #FujifilmXT5 #Tamron
Martin Ruskov
boosted

Please savor the irony of this coming from a rider on a team sponsored by a petrostate.
Martin Ruskov
boosted

Regardless of whether Americans think socialism is bad or good, or how they define it, most embrace socialist policies and programs – as long as no one calls them “socialist”.
Even in a deep red state like North Dakota, which has a state-run bank.
https://theconversation.com/even-in-conservative-north-dakota-some-socialist-institutions-thrive-286627
Martin Ruskov
boosted

“And there is that endless joke: there is one absurd, parody, completely inappropriate candidate – and he is standing against Count Binface. That one is kind of funny.”
https://www.theguardian.com/politics/2026/jul/11/unstoppable-rise-of-count-binface-clacton-farage
Martin Ruskov
boosted
In an era of extreme weather, climate uncertainty, geopolitical tensions and rising fertilizer costs, keeping soil healthy and nurturing the billions of microbes living there is not only necessary but also economically strategic.
Martin Ruskov
boosted

Verdant Beauty, Wide-Open Spaces, Elegant Architecture: Have a Look at 15 Photos That Show Why Central Park Is the Lifeblood of Manhattan
https://www.smithsonianmag.com/travel/verdant-beauty-wide-open-spaces-elegant-architecture-have-a-look-at-15-photos-that-show-why-central-park-is-the-lifeblood-of-manhattan-180989067/?utm_source=flipboard&utm_medium=activitypub
Posted into Travel @travel-Smithsonianmag
Martin Ruskov
boosted
Despite the impression many people might get from the news, the U.S. murder rate fell nearly 20% in 2025, likely making it the lowest since reliable national records began in 1960.
Why? A criminologist says the answer isn't any single policy — it's a combination of major social trends (thread) ⬇️
https://theconversation.com/the-us-murder-rate-fell-to-historic-lows-in-2025-heres-why-276826
Martin Ruskov
boosted
Young women are much more likely than young men to identify as LGBTQ+, according to new research.
28.5% of Gen Z women identified as LGBTQ+, compared with 10.6% of Gen Z men
Here's what the researchers think is behind the trend: https://theconversation.com/young-women-are-identifying-as-less-straight-young-men-not-so-much-283936
This is how the IDF under fundamentalist command deliberately kills any hope for a constructive non-military leadership at any level in Palestine
Martin Ruskov
boosted

RE: https://mastodon.social/@grimalkina/116875279208507179
Preorder from authors.
You will see authors like your girl here start to sound a little bit unhinged when we talk about "preorders." But WHY. It's because a book that se...
Martin Ruskov
boosted

I hit a wall using Blender. I was missing a plugin I relied on in After Effects: ToothPaste.
So I built one. Fought AI for months. Got a developer friend involved. Eventually, it worked.
Published it free on Blender Extensions. 2K downloads in a few months.
Pride and imposter syndrome clashed. But I published it anyway.
I guess others needed it too. That's enough of a prize for me.
Have you tried building your own tools?
Martin Ruskov
boosted
One of the biggest predictors of a female baboon's long-term health isn't strength or speed.
It’s friendship and family.
Strong social bonds lower stress and are linked to longer lives – with striking parallels to humans.
Martin Ruskov
boosted

“In London cyclists now outnumber cars in the City by 2 to 1. Paris, where they now outnumber motorists across the whole city, is catching up with Europe’s traditional bike capitals, Amsterdam & Copenhagen…In Copenhagen, bikes account for almost half of commuter trips to work/school.” @economist.com@bsky.brid.gy
Forget EVs. Cycling is revolut...
Martin Ruskov
boosted
An ethicist who teaches about conflict resolution got into a chilly dispute with her neighbor over her dog’s behavior.
Here’s what she learned from the incident about getting along:
https://theconversation.com/civility-requires-the-willingness-to-engage-a-dispute-with-a-neighbor-revealed-how-much-motivation-matters-274359
Martin Ruskov
boosted

Do you hope YOUR admin, mods and community managers have filled this out? Forward the link, takes only 5 minutes!
(Boosts for visibility greatly appreciated)
Karen Hao on OpenAI and Silicon Valley
> One of the things that you really have to understand about AI development today is that there are what I call quasi-religious movements that have developed within Silicon Valley. The concept of artificial general intelligence is not one that’s scientifically grounded.
https://www.democracynow.org/2026/7/3/journalist_karen_hao_on_sam_altman
@arificial_inter@lemmy.ml
- Games
- https://mapto.itch.io
- Others (+fedi)
- https://linktr.ee/mapto
Studying how people interact, in the past (#CulturalAnalytics) and today (#EdTech #Crowdsourcing). Researcher at @IslabUnimi, University of Milan. Bulgarian activist for legal reform with @pravosadiezv. I use dedicated accounts for different languages.
My profile is searchable with https://www.tootfinder.ch/
Joined Nov 2022
