
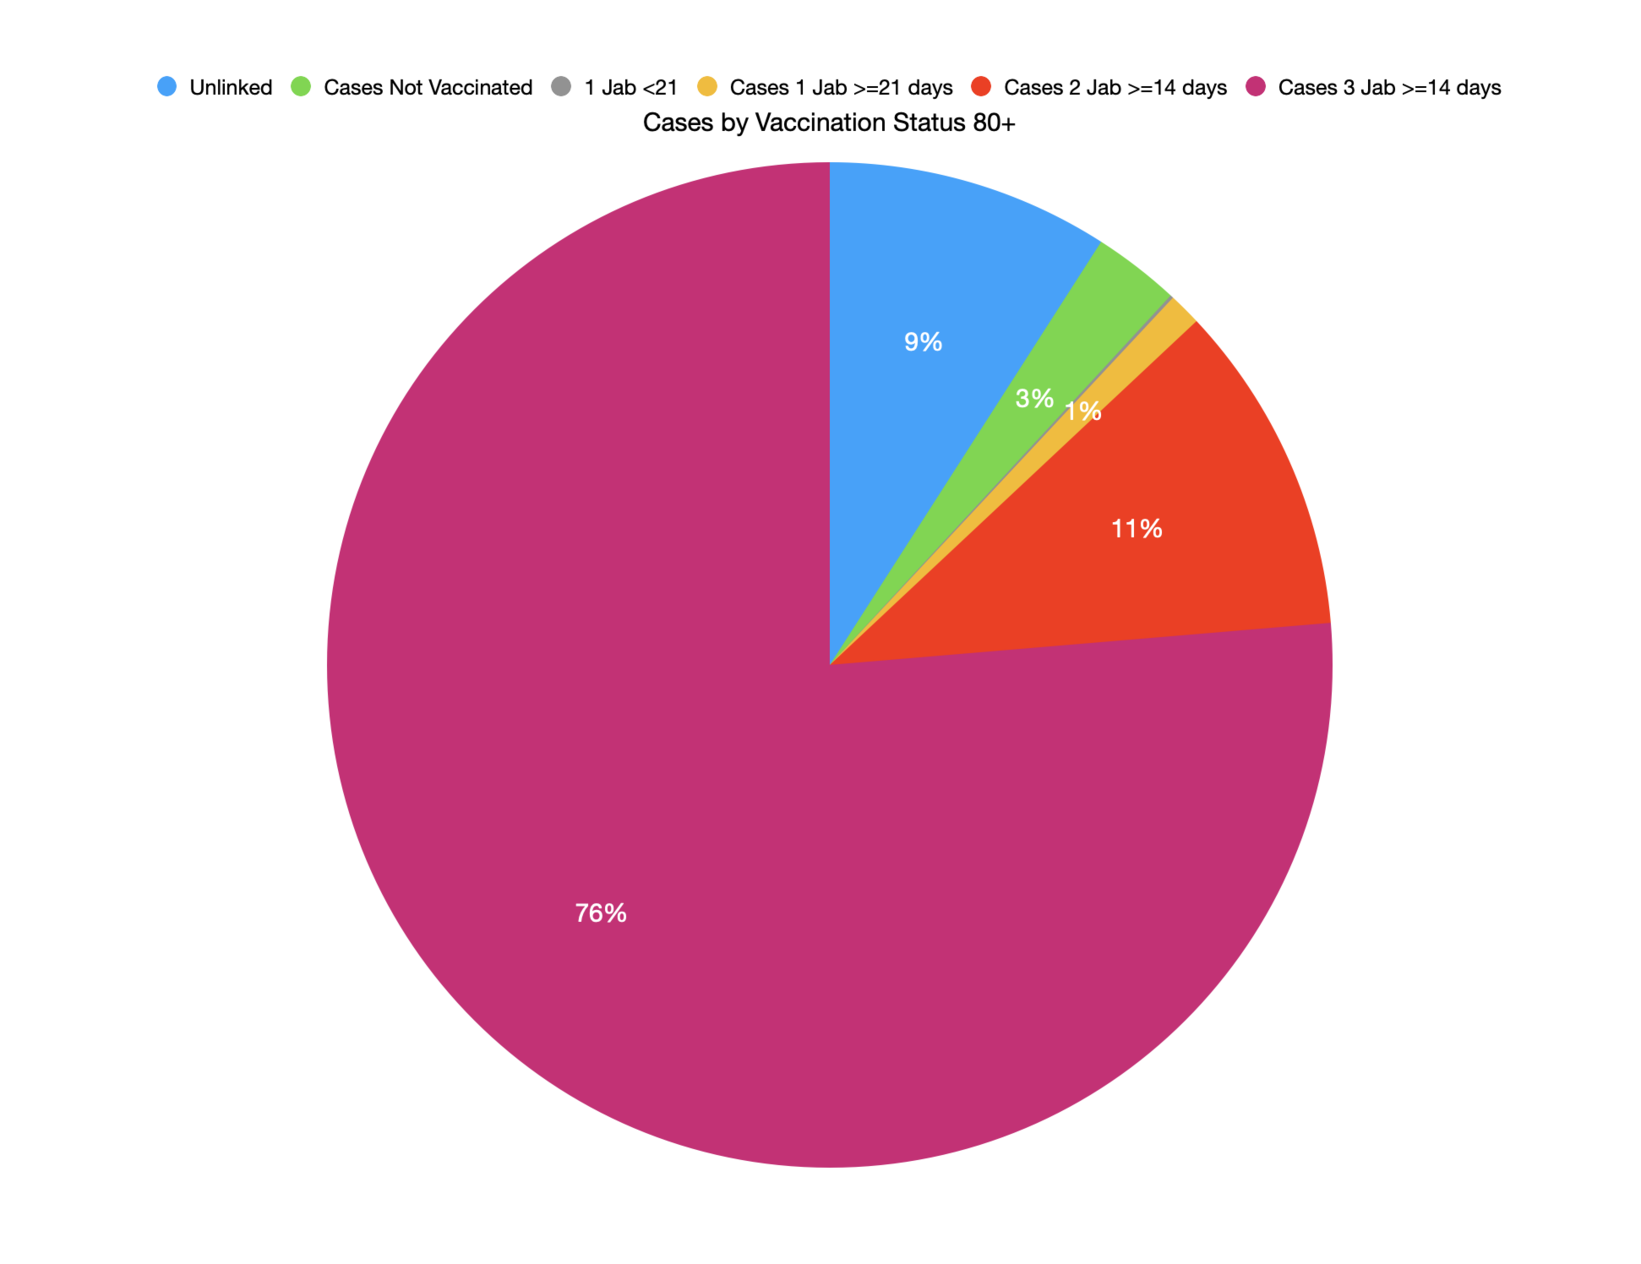
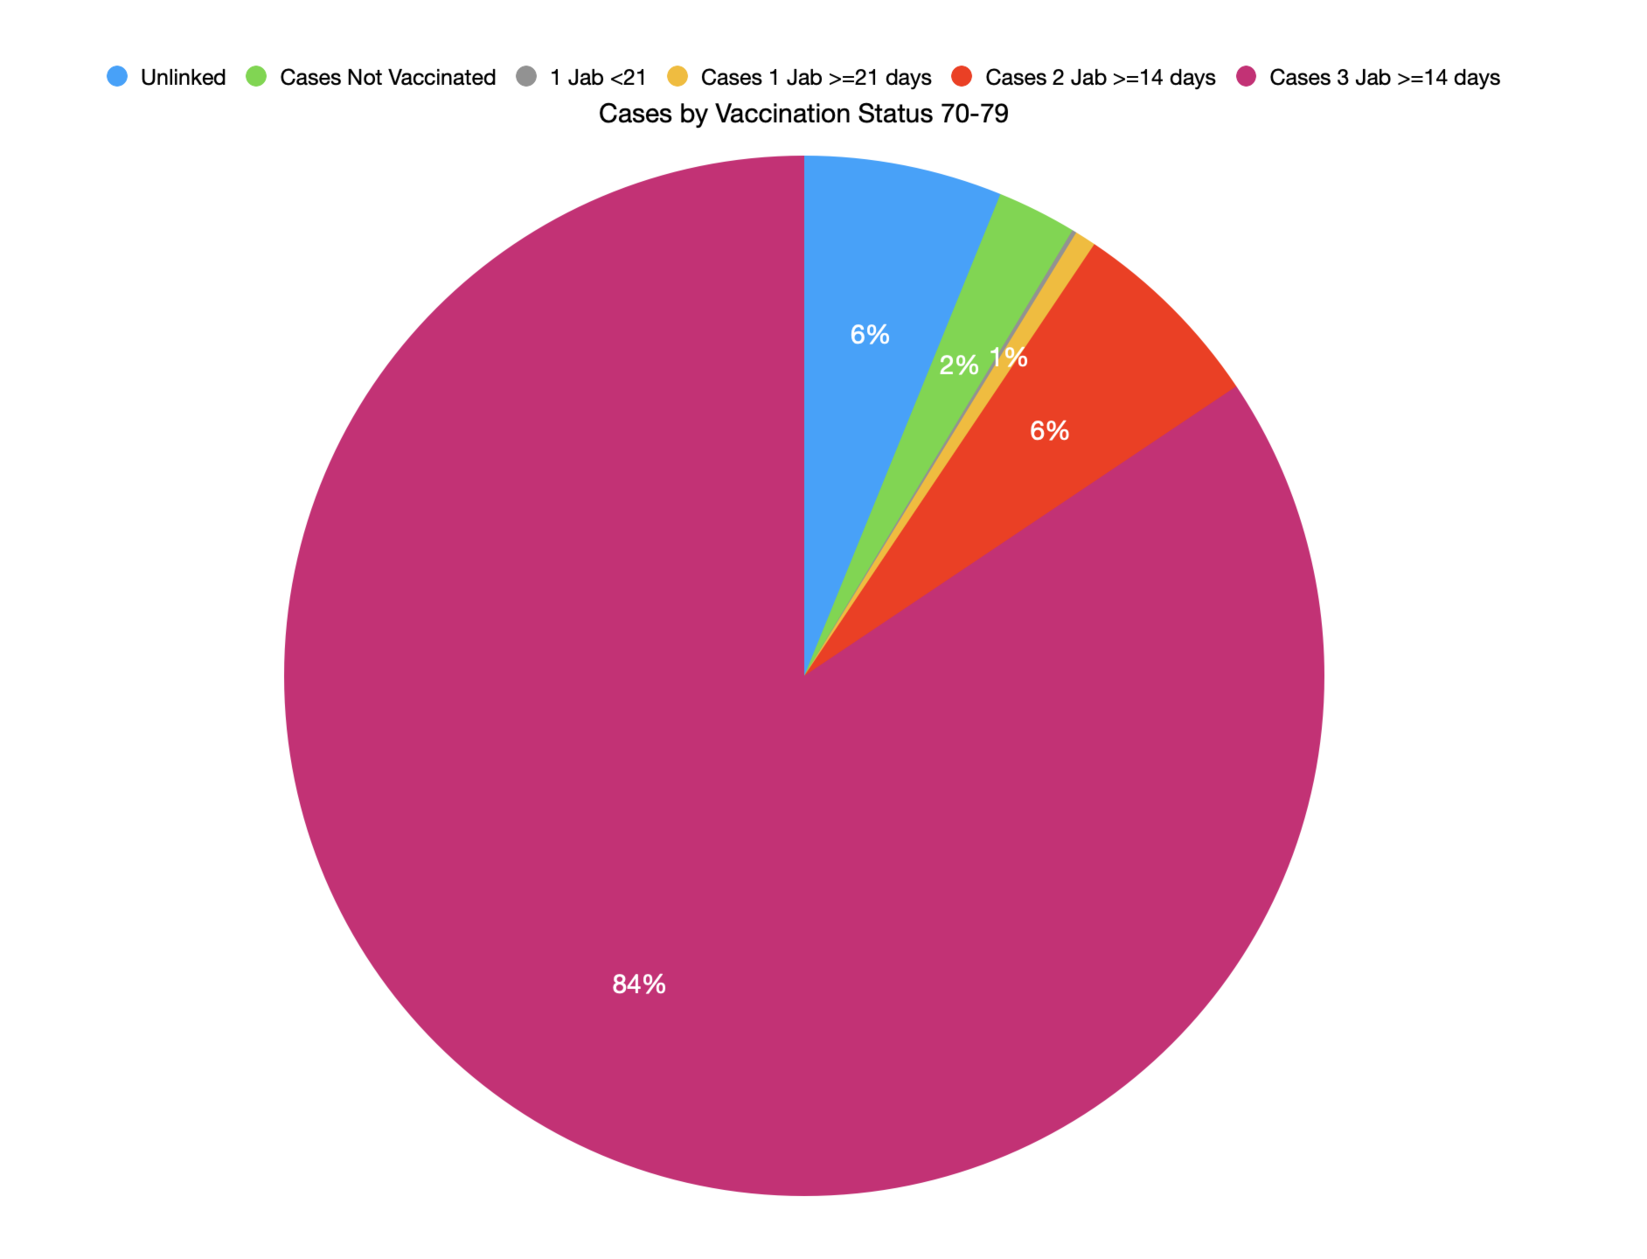
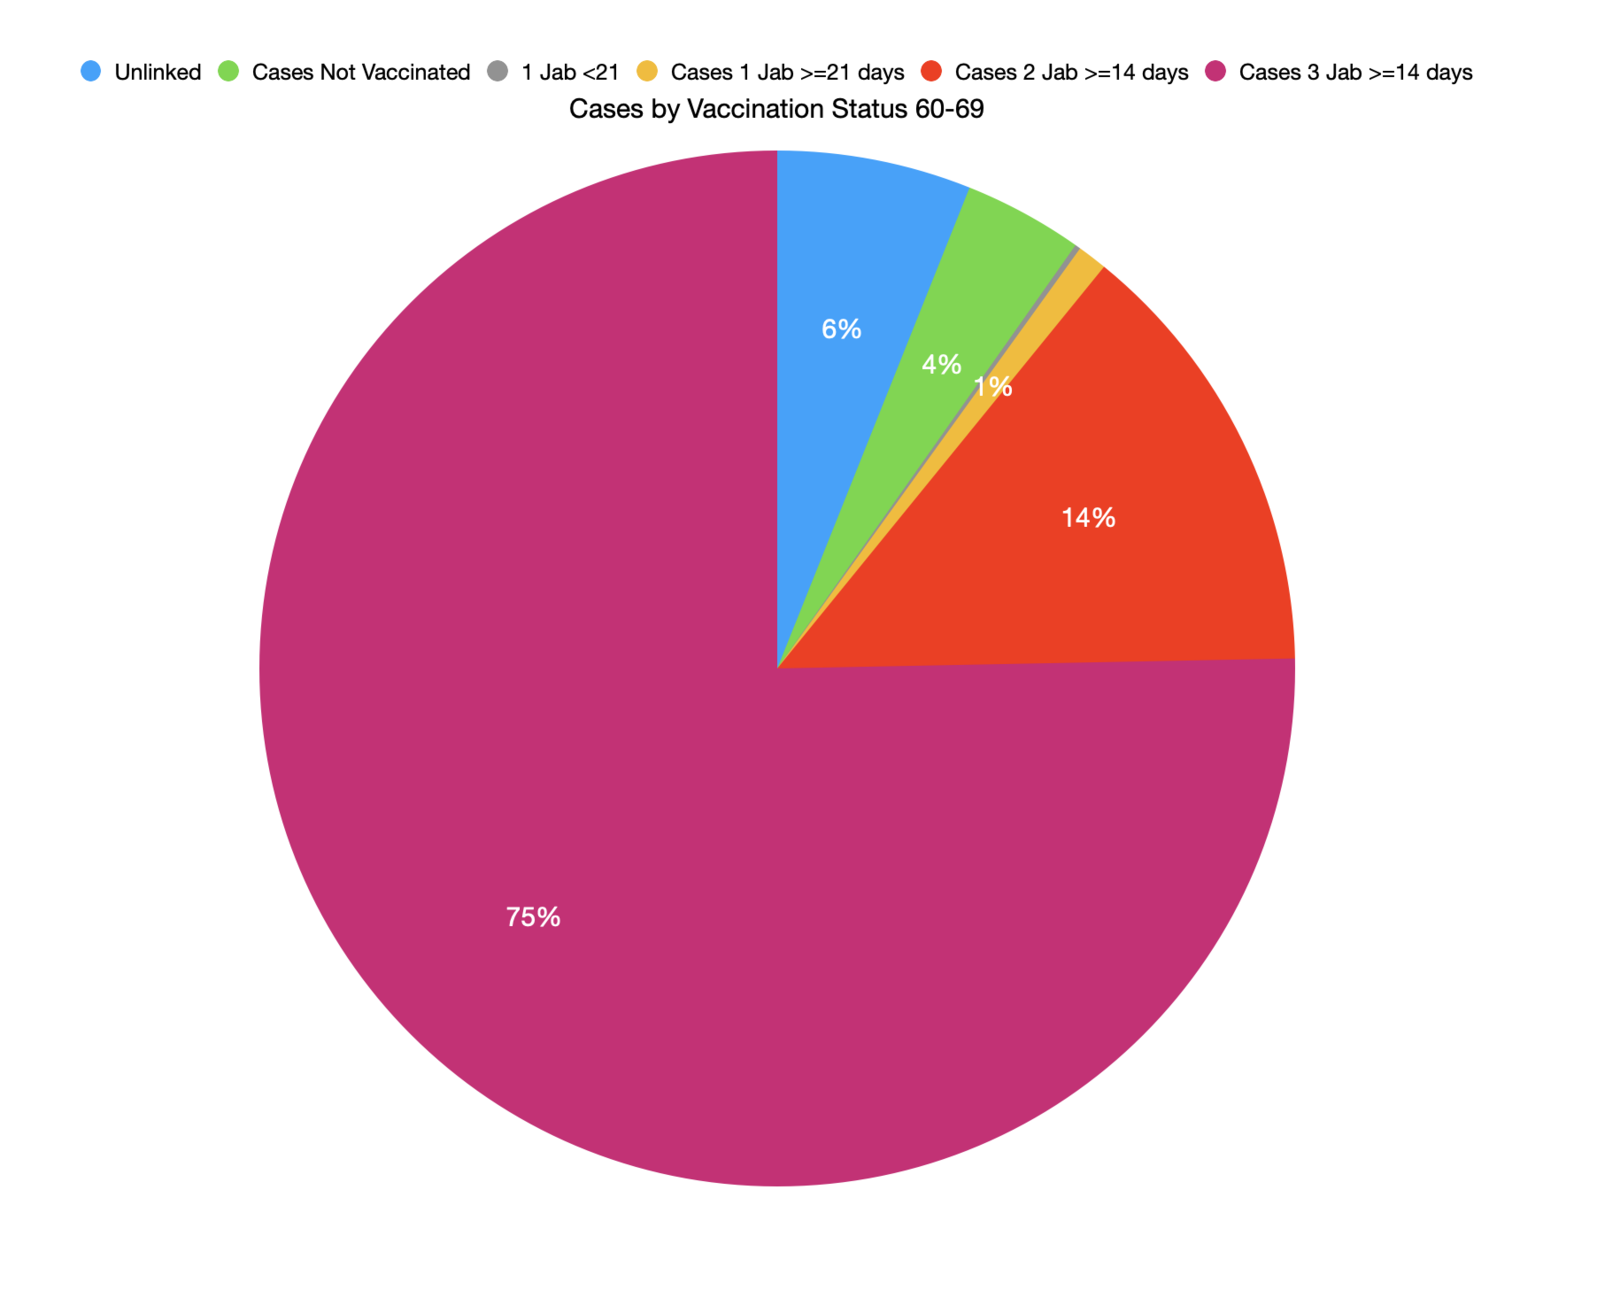
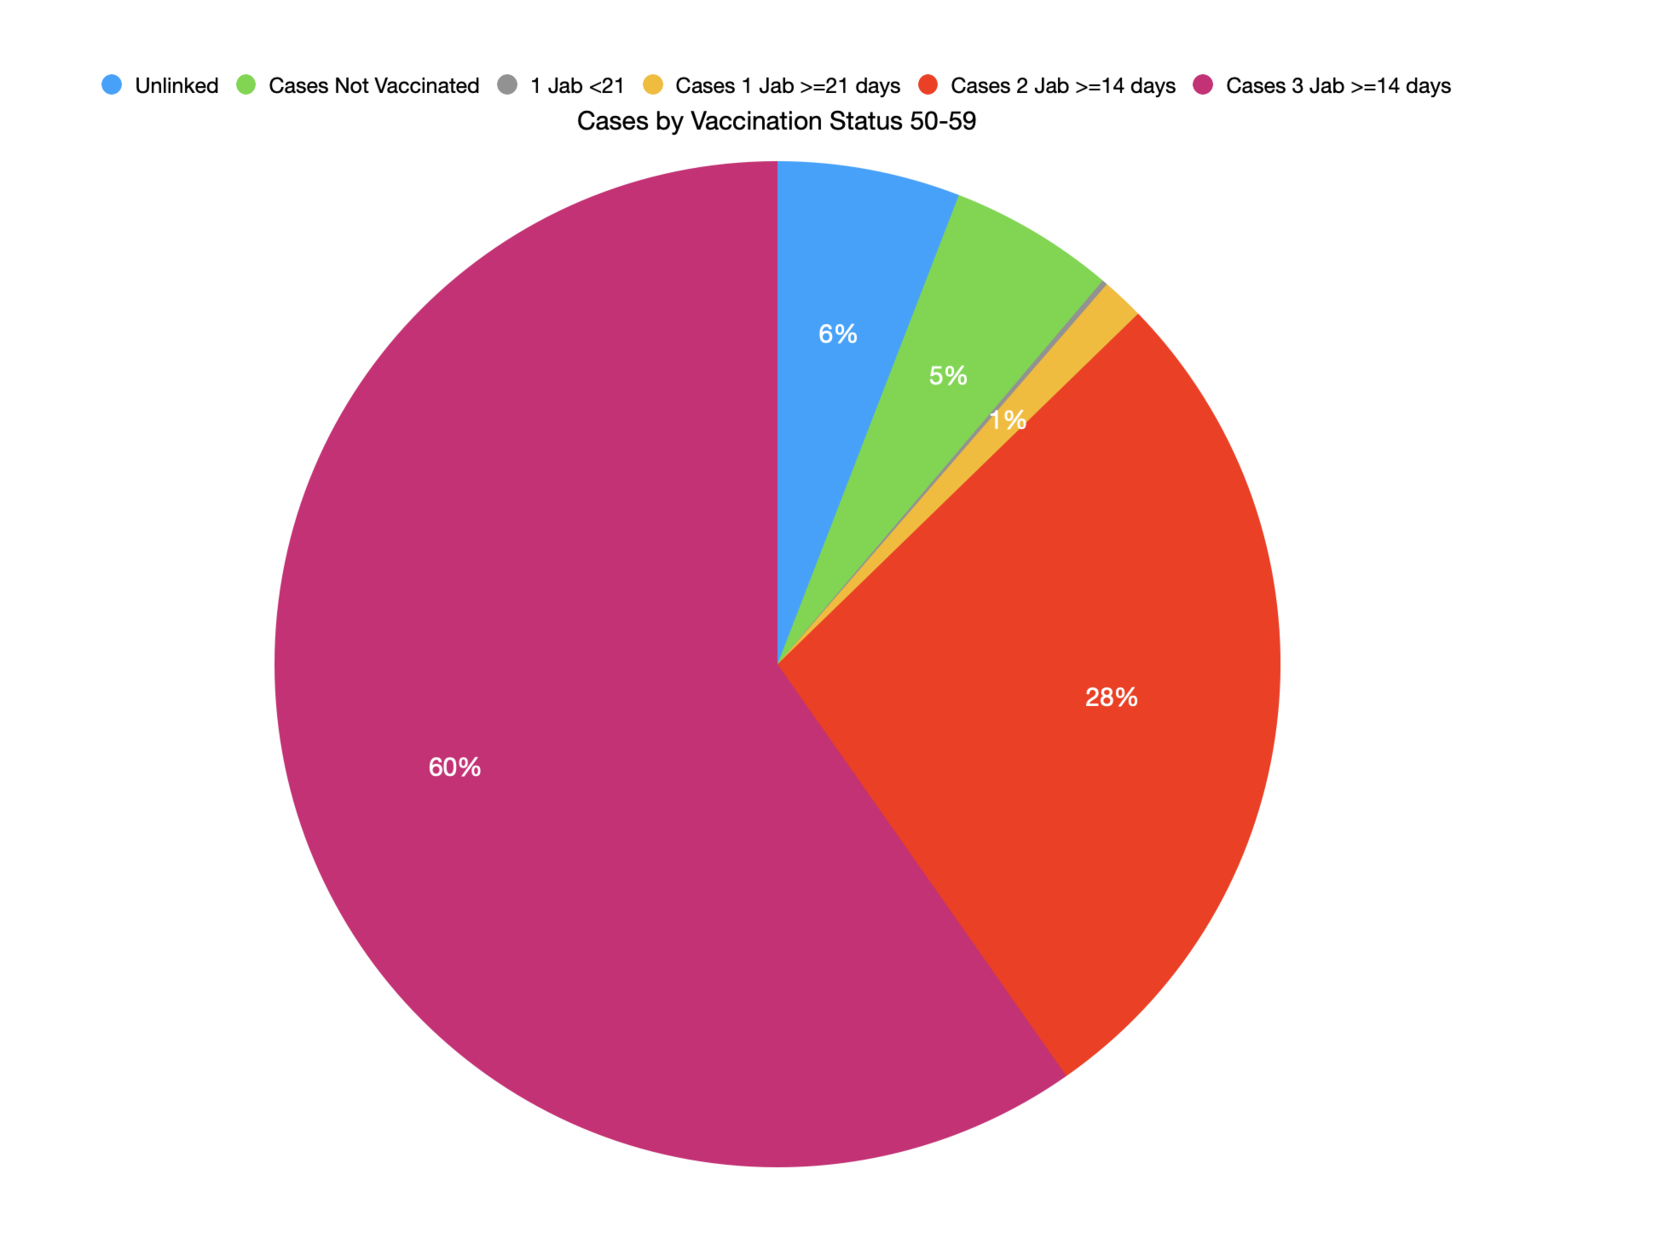
The naked Emperor. 🤡
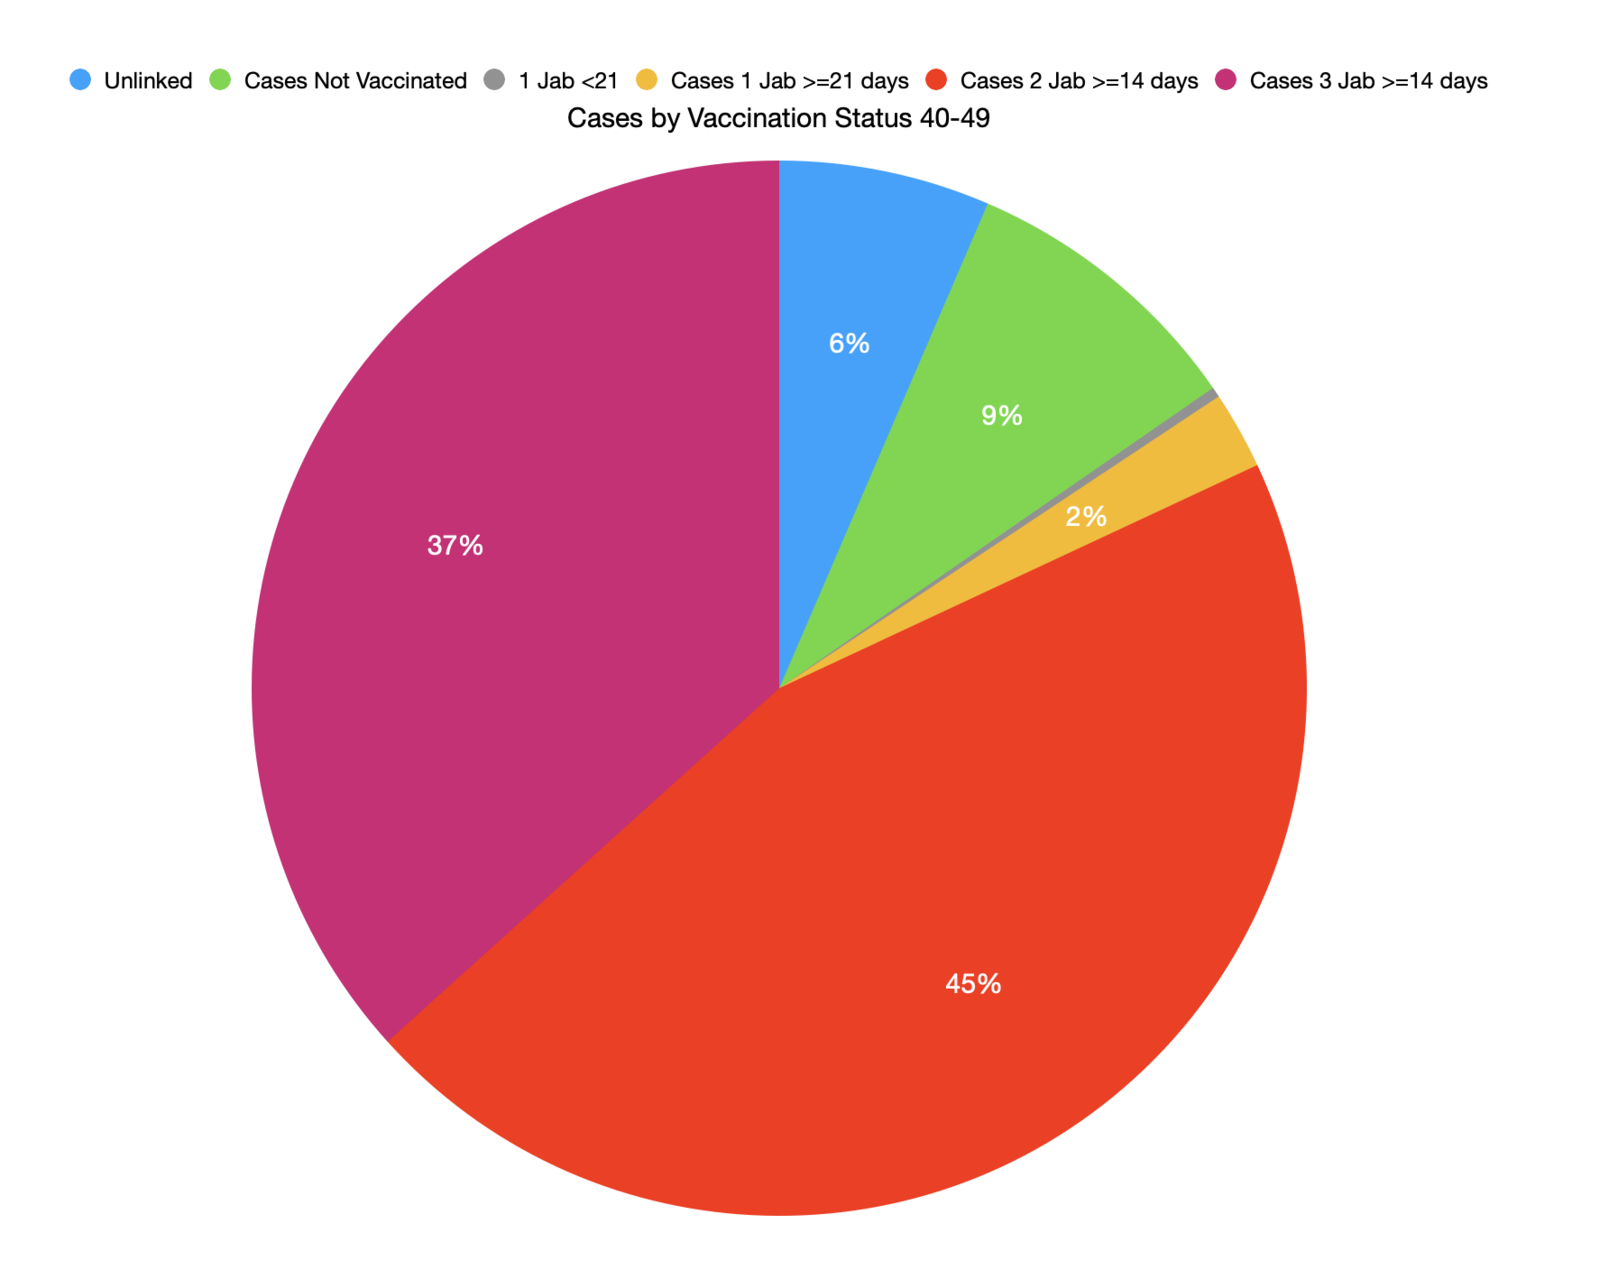
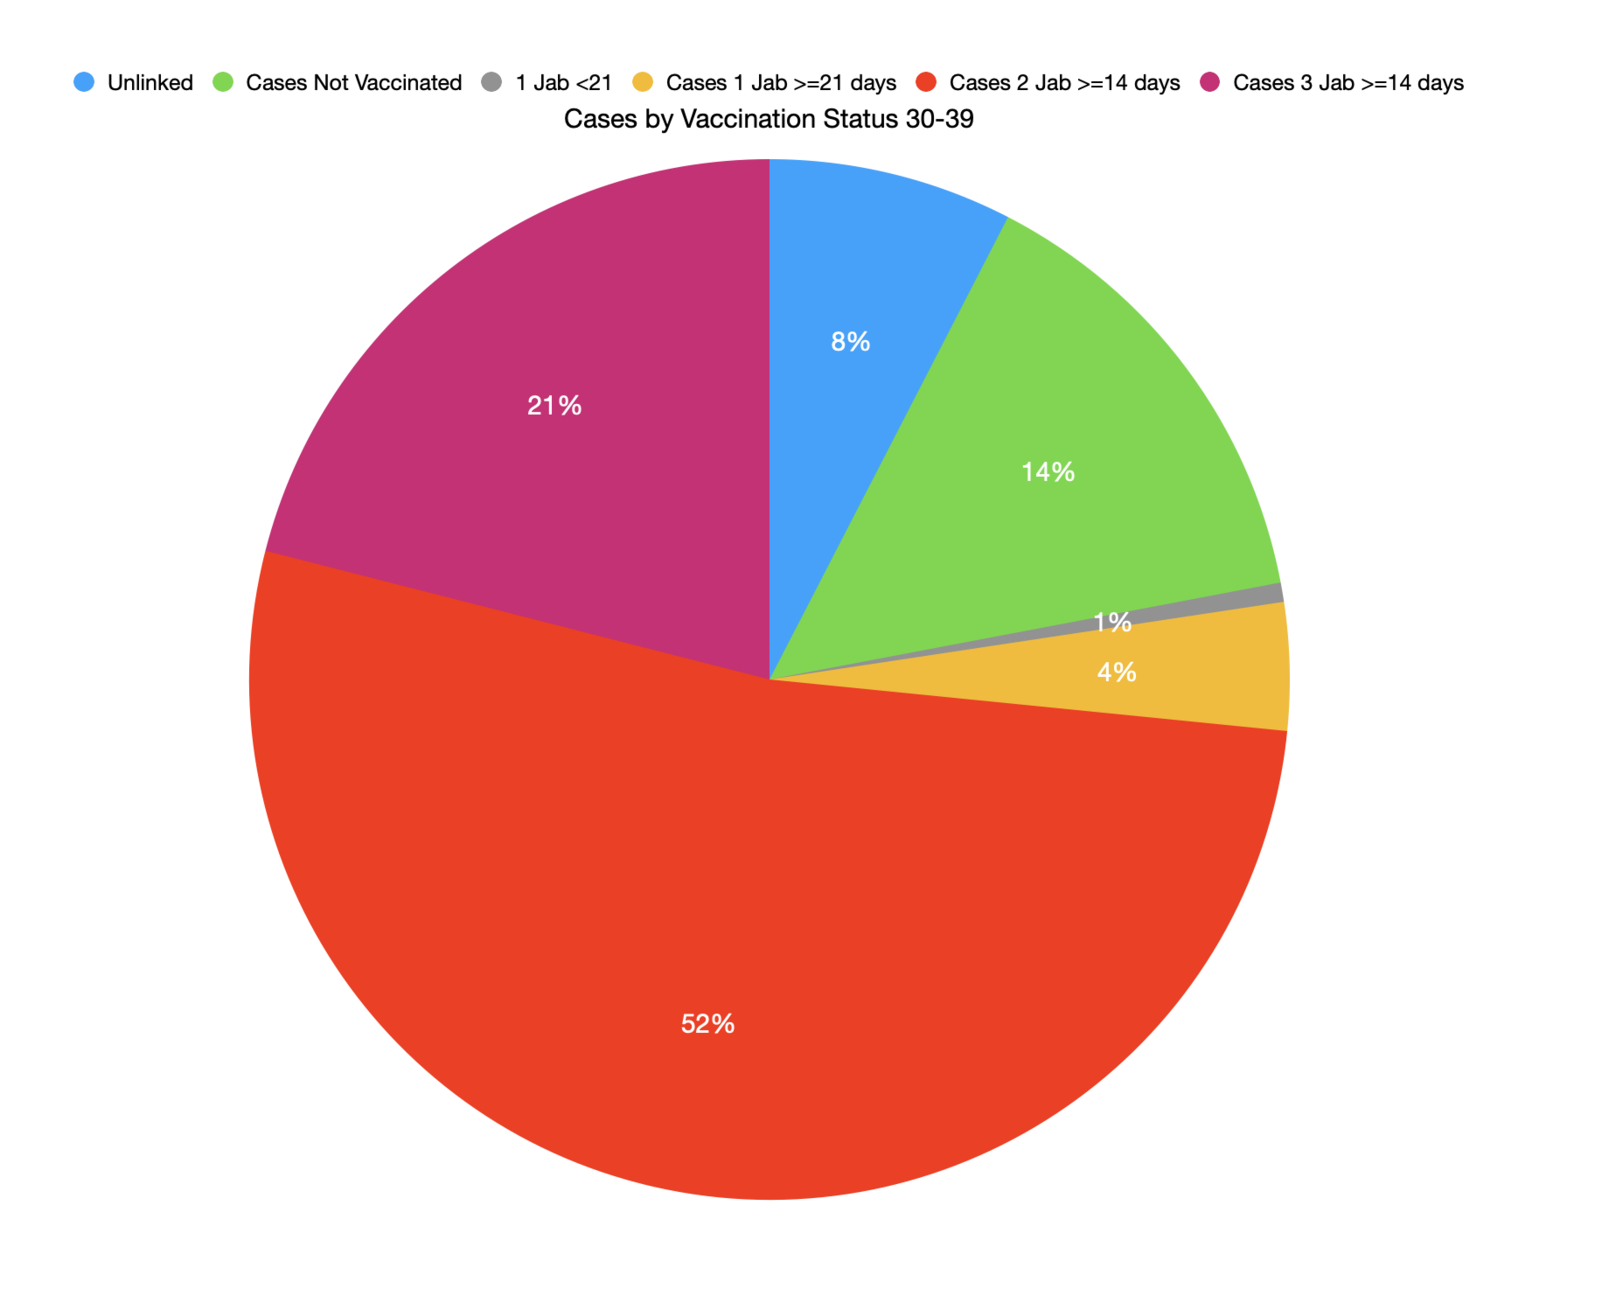
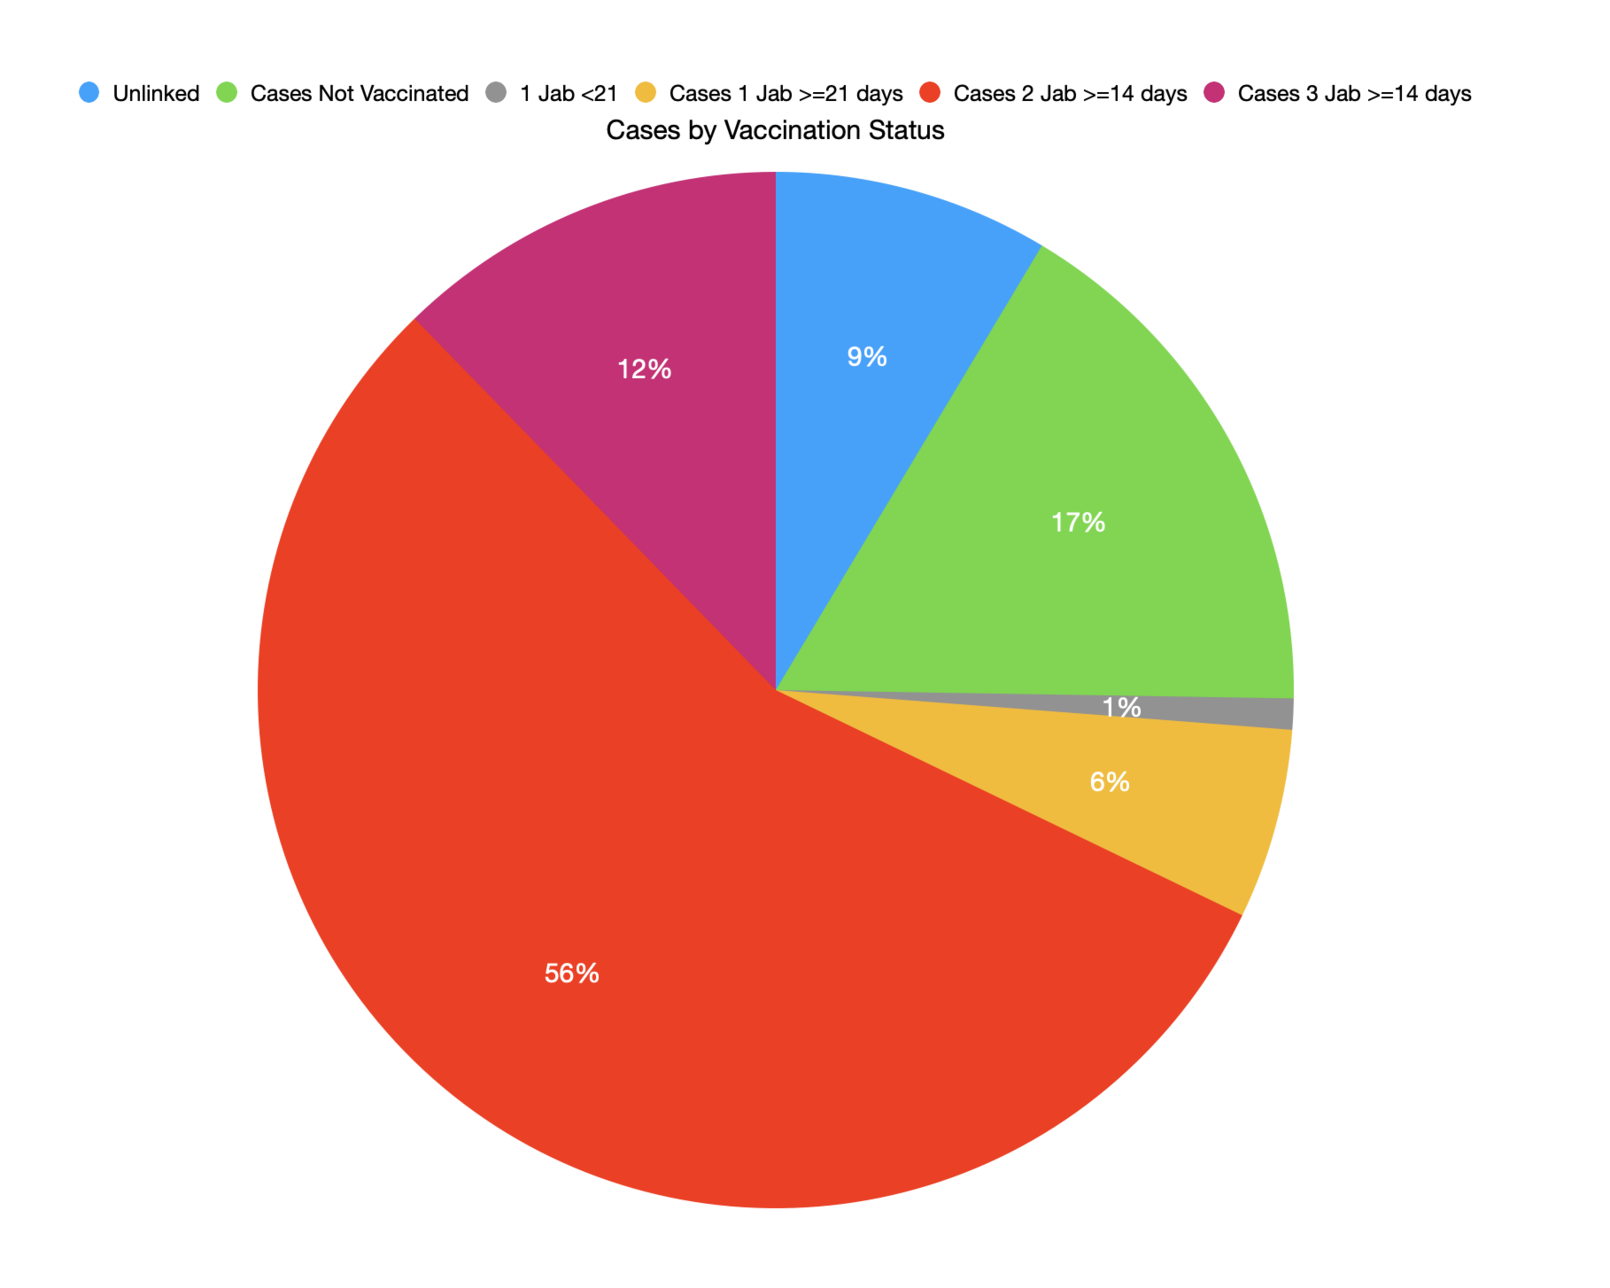
UKHSA released vaccine related data this week which had the numbers for the 'boosted' population.
Great success?

@YorkshireTea could you get these numbers per 1000? this would wash out the difference in relative numbers of vaccinated Vs unvaccinated etc.

They did used to publish the rates per 100K but when they started to become embarrassing they bowed to pressure and removed them sadly.
I agree with the point you're making, confounding variables etc.
I was just showing these 'vaccines' aren't doing much, if anything at all, to stop the spread.
The graphs below from the same datasheets give an idea regards % uptake by age cohort.
@YorkshireTea @roboneko it's wild that they stopped doing 100k...
I can find these on the ONS site?
if I get some time I might see what I can pull together

Another question is how severe the symptoms (and also death rate) were. Something that blunts the symptoms is still of benefit. Something that makes the symptoms worse is directly harmful.
There's also the question about a "foxhole effect" raised by that journal article a while back. Since these groupings don't break out people who *recently* received a dose in their own category but instead (presumably) lump them in with those of one fewer dose that effect would be undetectable if it were present.