@Acer
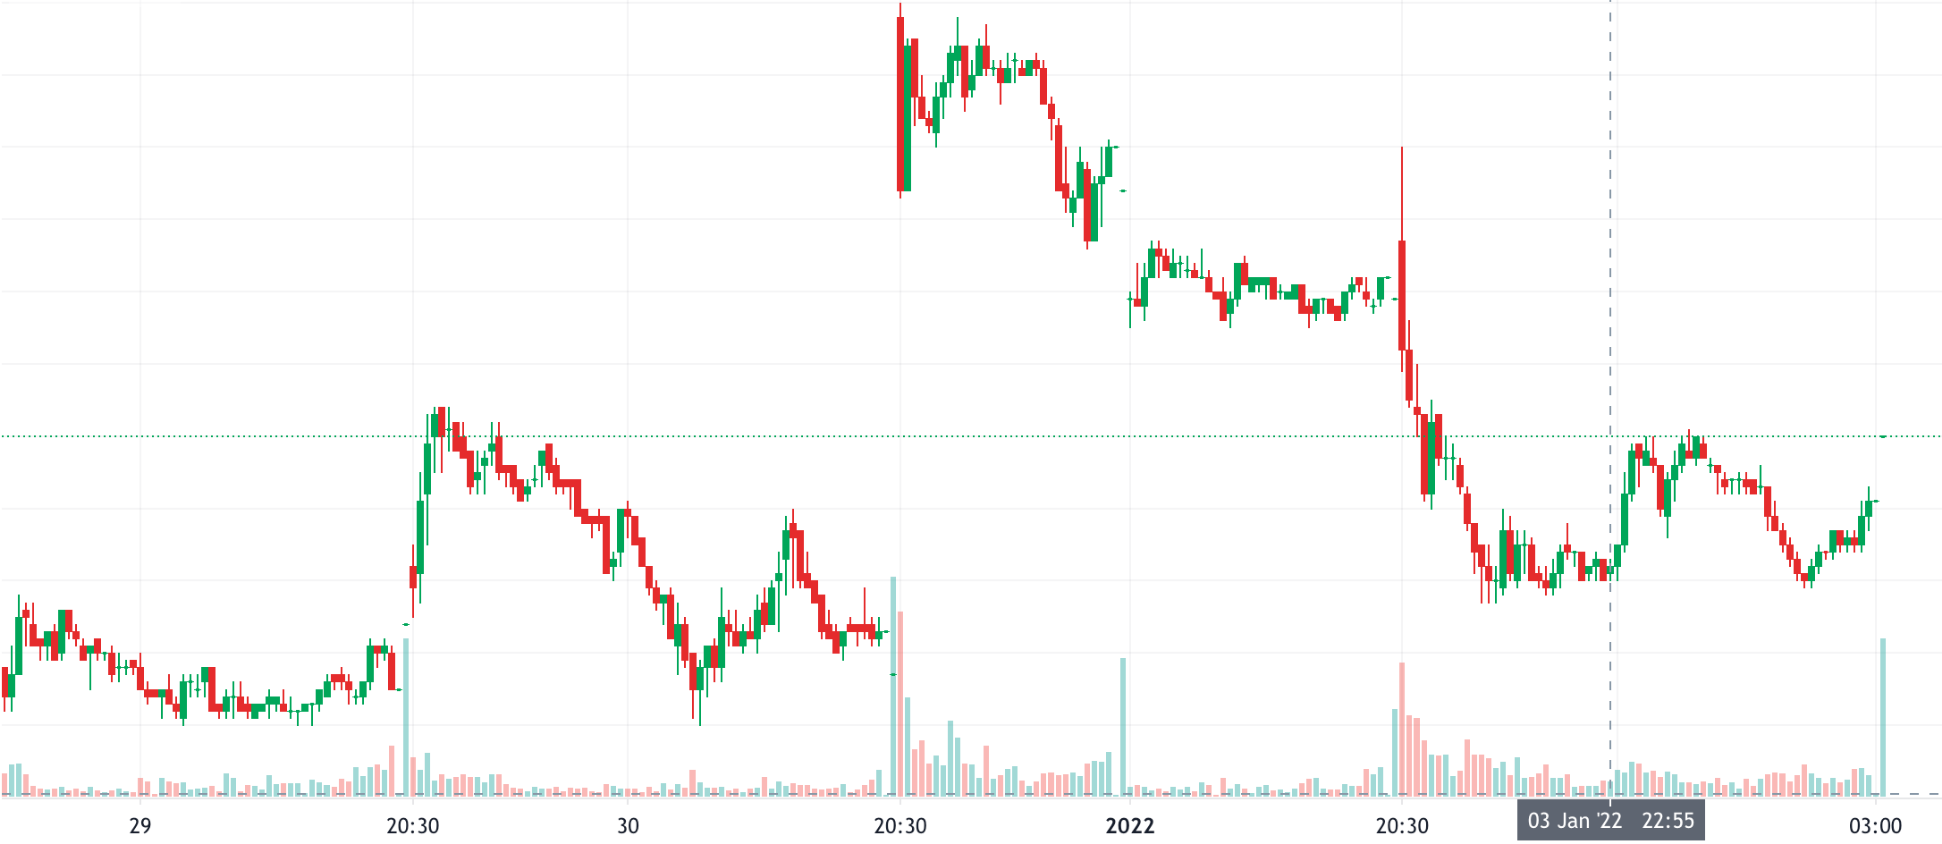
There are no value indicators on the y-axis, so we don't know if the bottom of the chart is zero or if the chart actually shows a narrow price range. The volume indicator shows an increase in volume at the time of movement and at other points before and after the movement, however, that also it difficult to judge because the chart is only for a few days so we can't tell if that volume is typical for that stock.
Where did this chart come from? Did you create it yourself?


@Acer
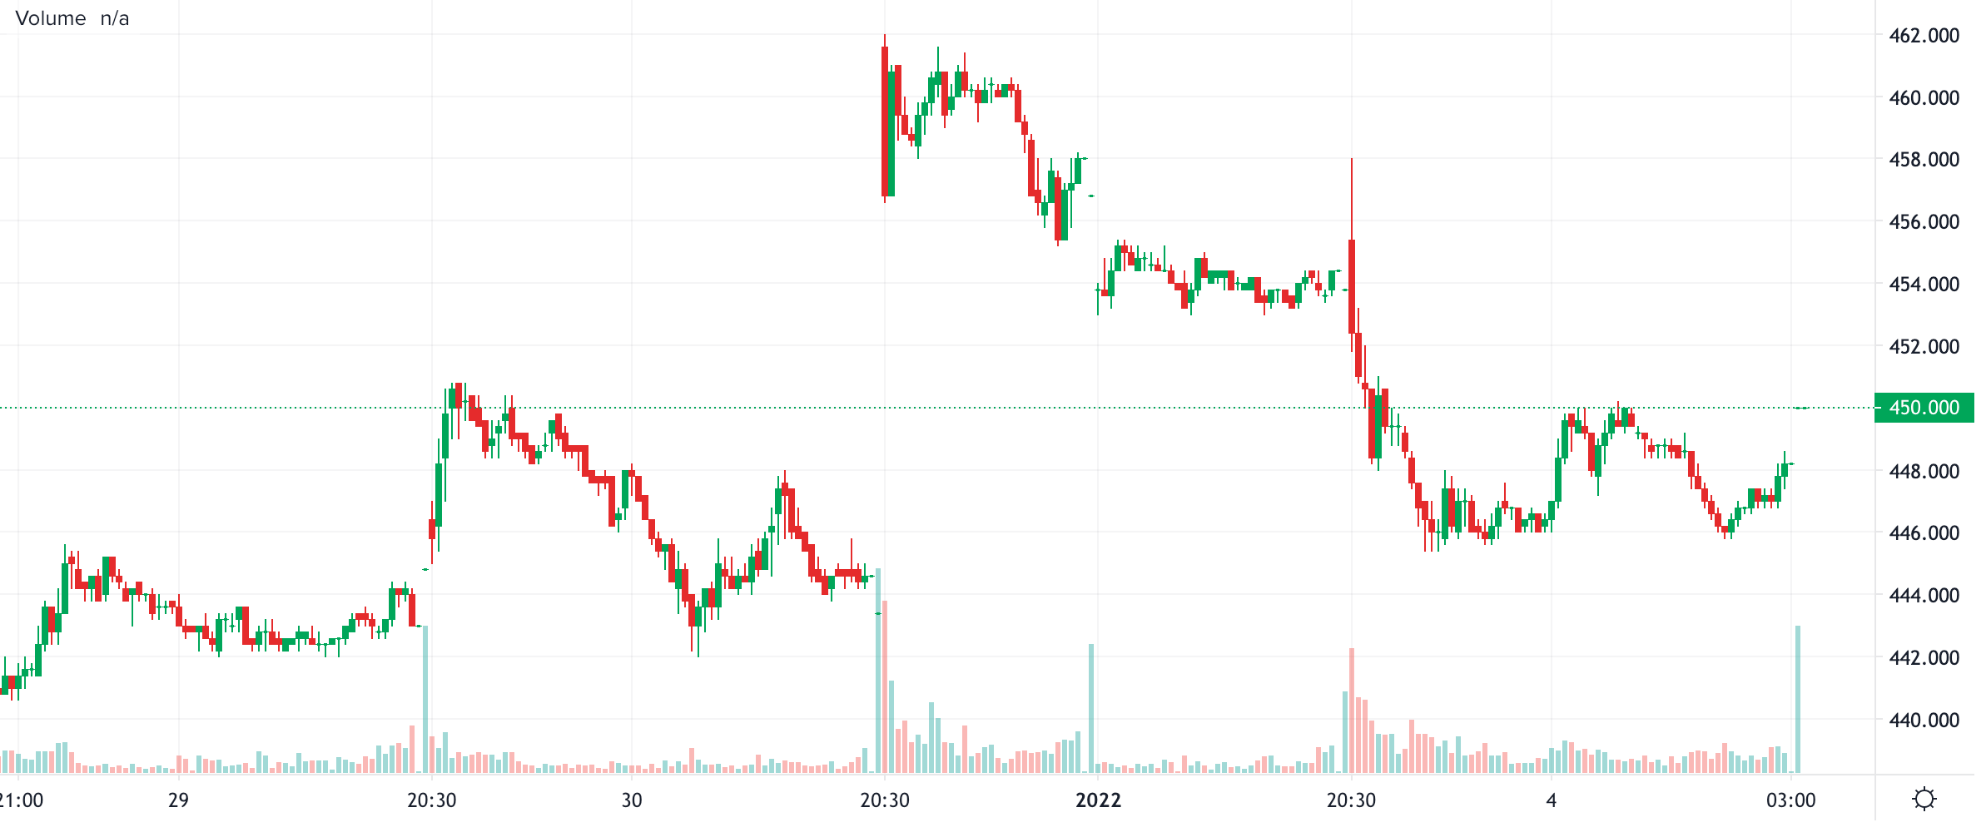
That's a 3.6% move. Not extraordinary, especially if it's a high-beta stock.
It's not a split.
If you can't find any news that would account for the move, it may be related to taxes. Buyers who are thinking about getting into the stock may purchase right before the end of the year so that they get a tax advantage.
The very sudden jump is probably due to the exchange opening and brokers settling orders they got during the time when the market was closed. (I'm not sure what timezone is shown or which exchange it trades in.)