

Lup Yuen Lee 李立源 @lupyuen@qoto.org
- Pronouns/Gender/Sexuality
- He/Him/They, Bisexual/Asexual 🇸🇬
- Date of Birth
- 1969
- Articles
- https://lupyuen.org
IoT Techie and Educator / Apache NuttX PMC
Joined Jan 2020
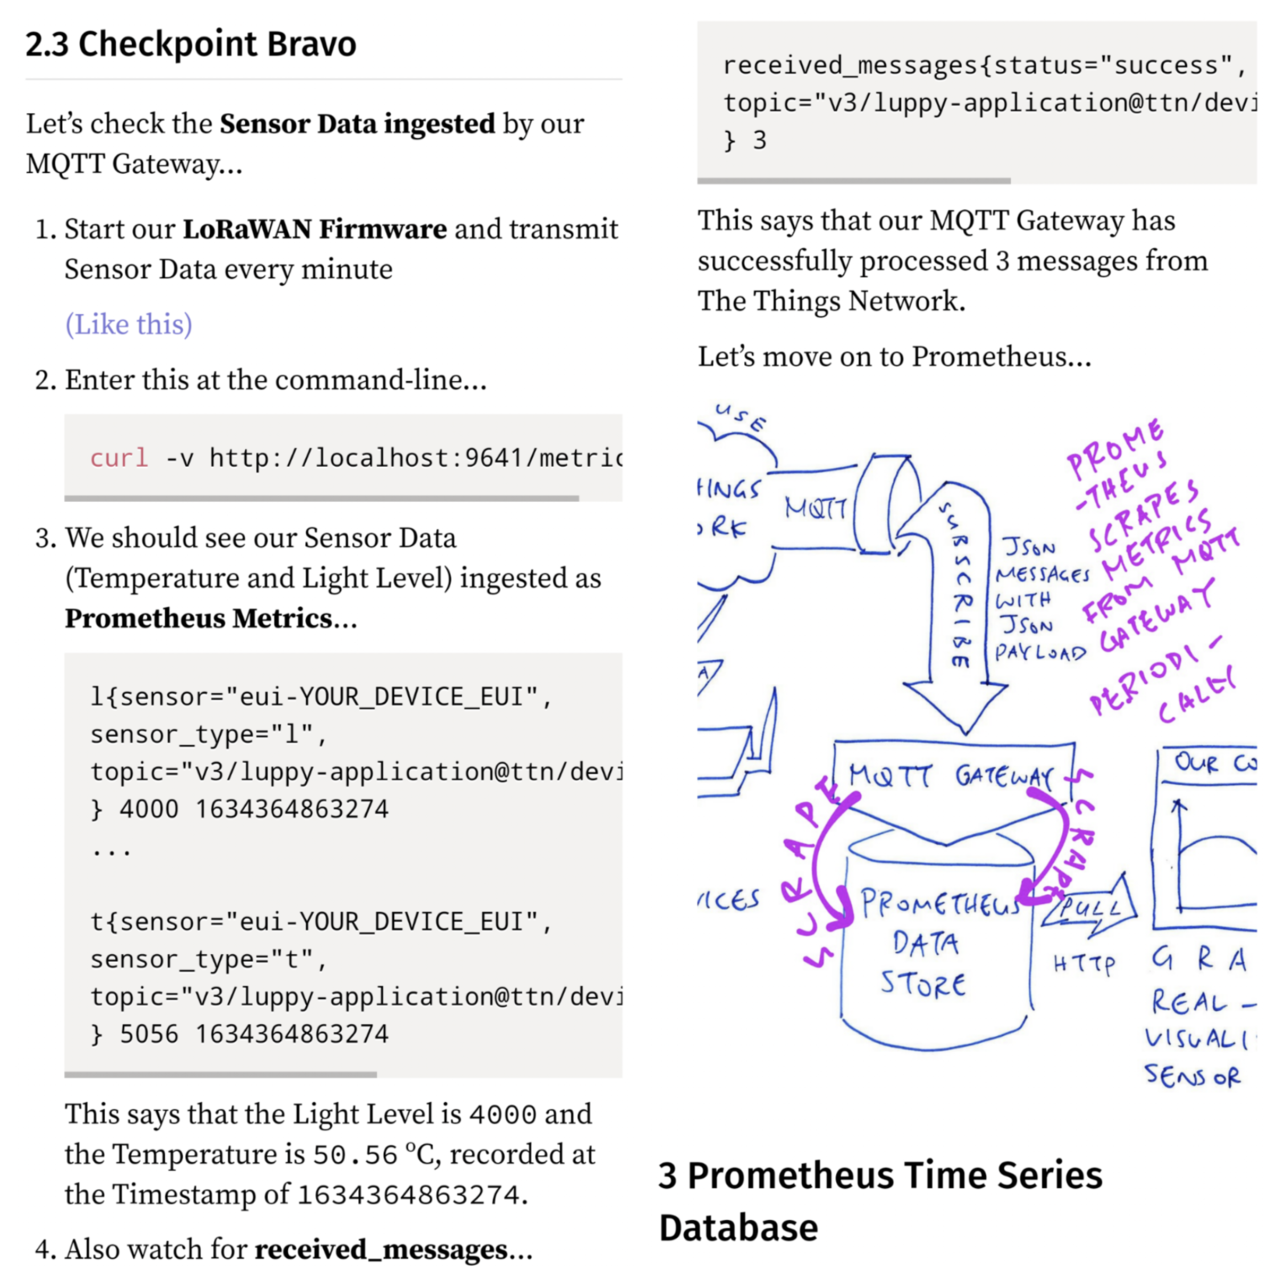
Checking #Prometheus for the Metrics scraped from #MQTT Gateway
https://lupyuen.github.io/articles/prometheus?10#checkpoint-charlie
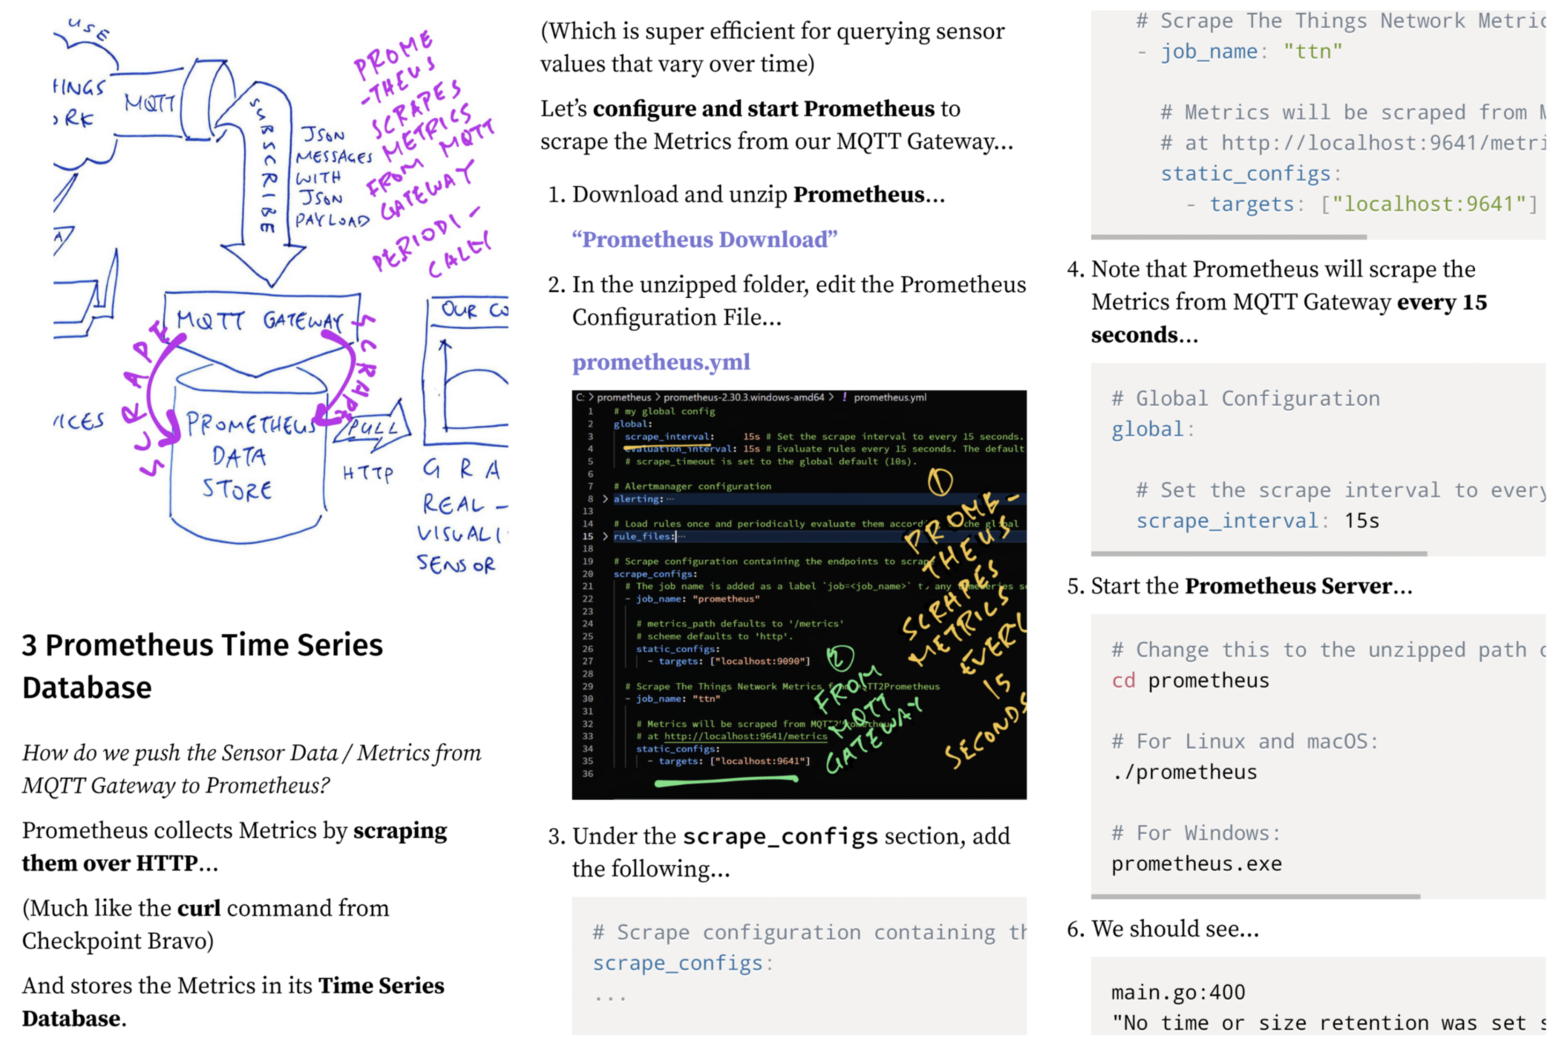
Configuring #Promethus to scrape metrics from #MQTT Gateway
https://lupyuen.github.io/articles/prometheus?9#prometheus-time-series-database
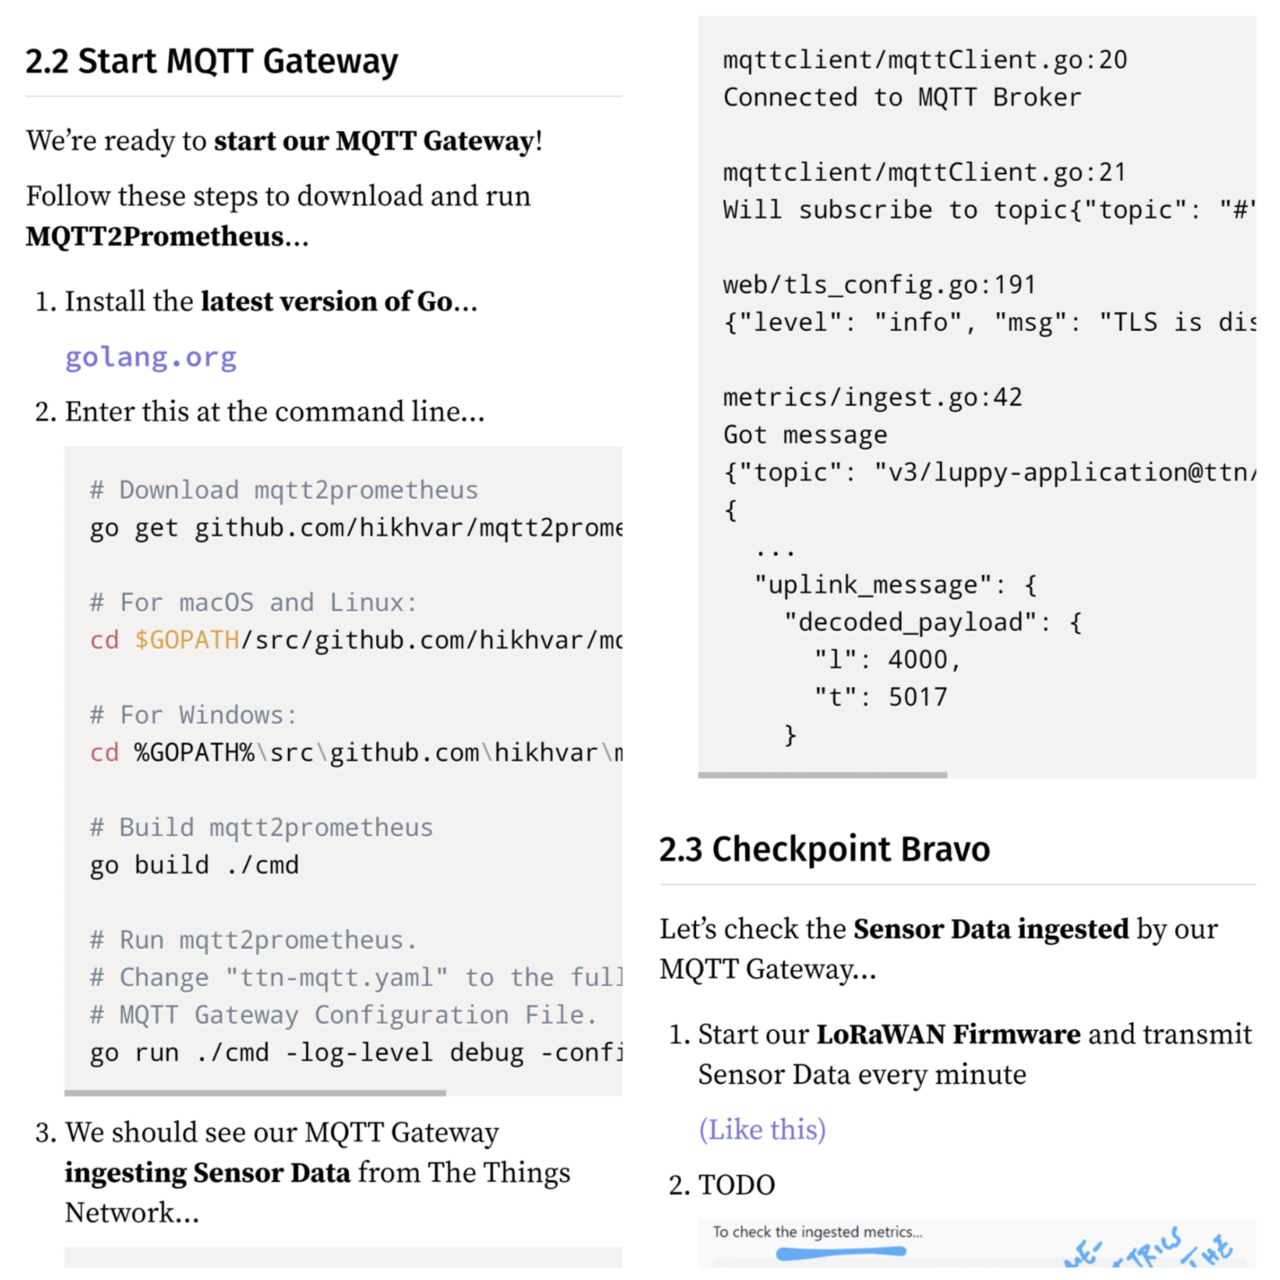
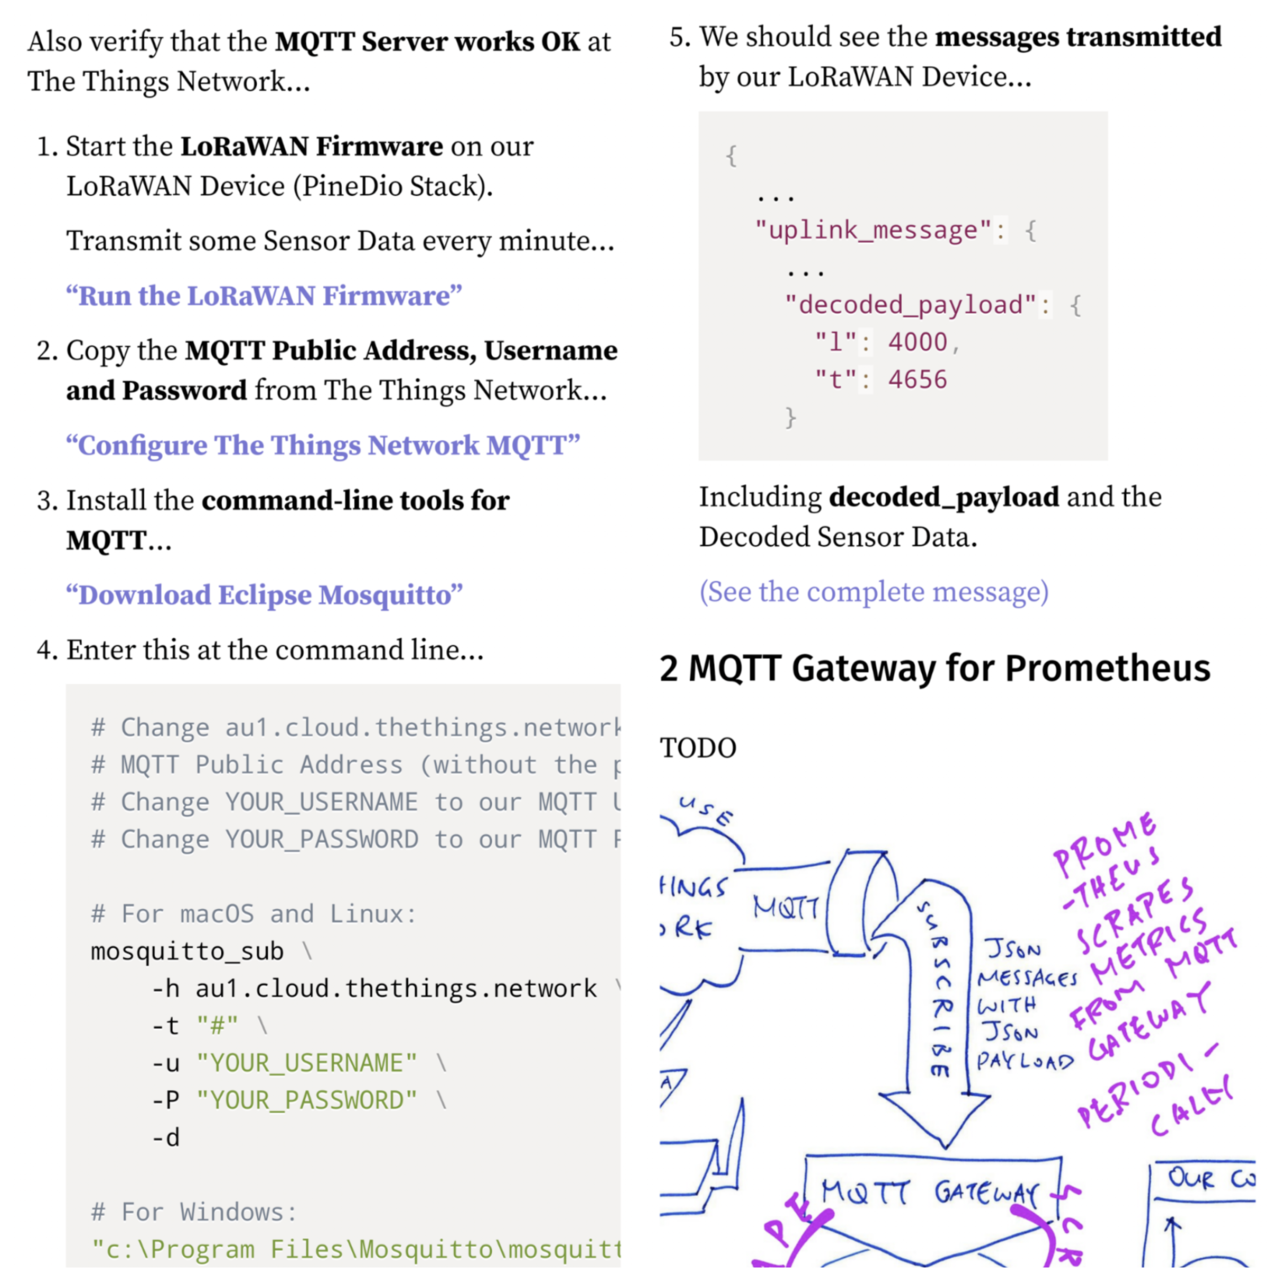
How we install and run #MQTT Gateway for #Prometheus
https://lupyuen.github.io/articles/prometheus?7#start-mqtt-gateway
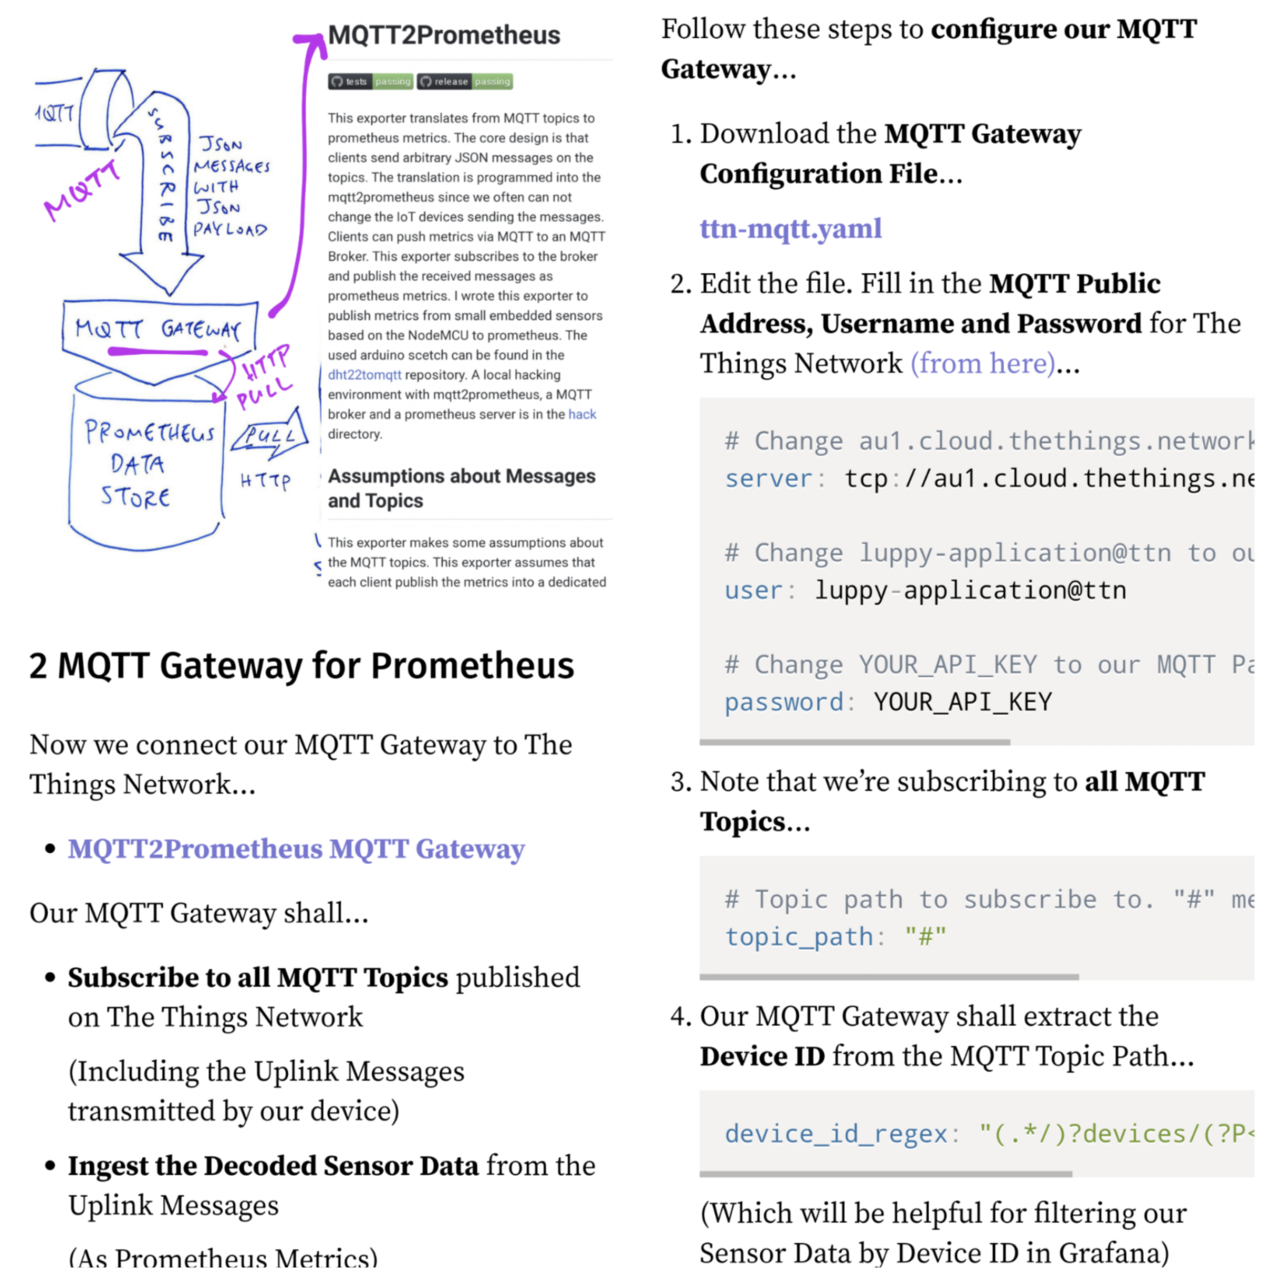
Defining the #Prometheus Metrics for our Sensor Data at #TheThingsNetwork
https://lupyuen.github.io/articles/prometheus?6#prometheus-metrics
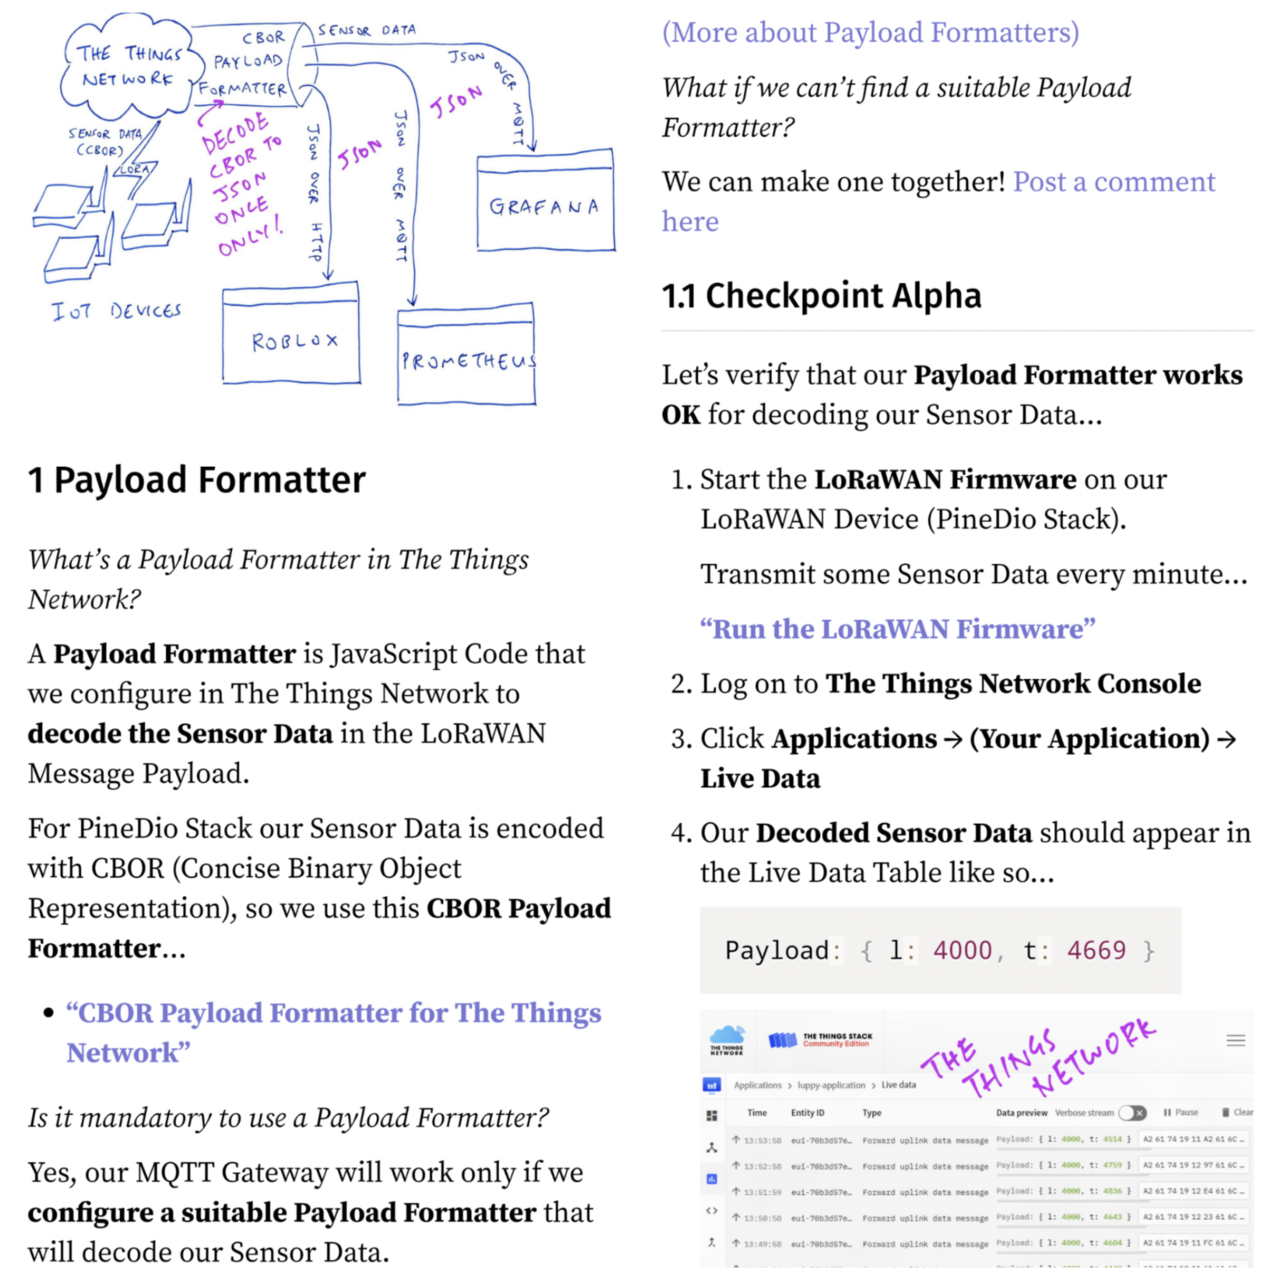
Configuring a Payload Formatter for #TheThingsNetwork
https://lupyuen.github.io/articles/prometheus?3#payload-formatter
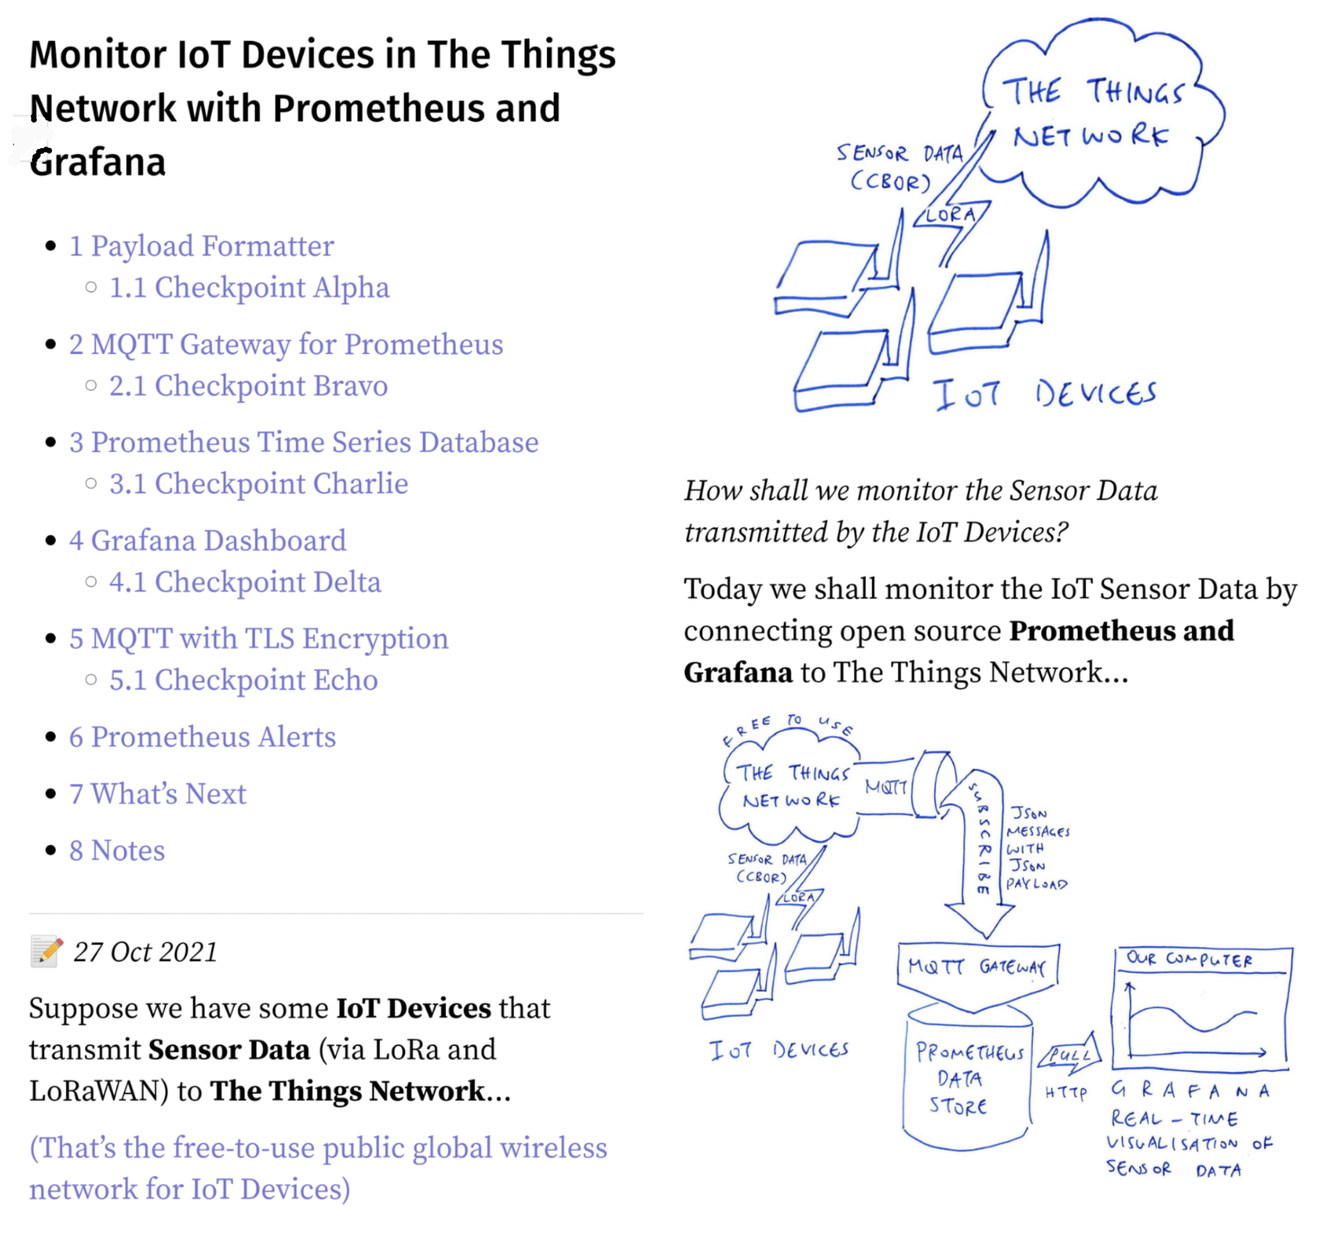
Monitoring our #IoT Devices connected to #TheThingsNetwork ... With #Prometheus and #Grafana ... All shall be explained in this article
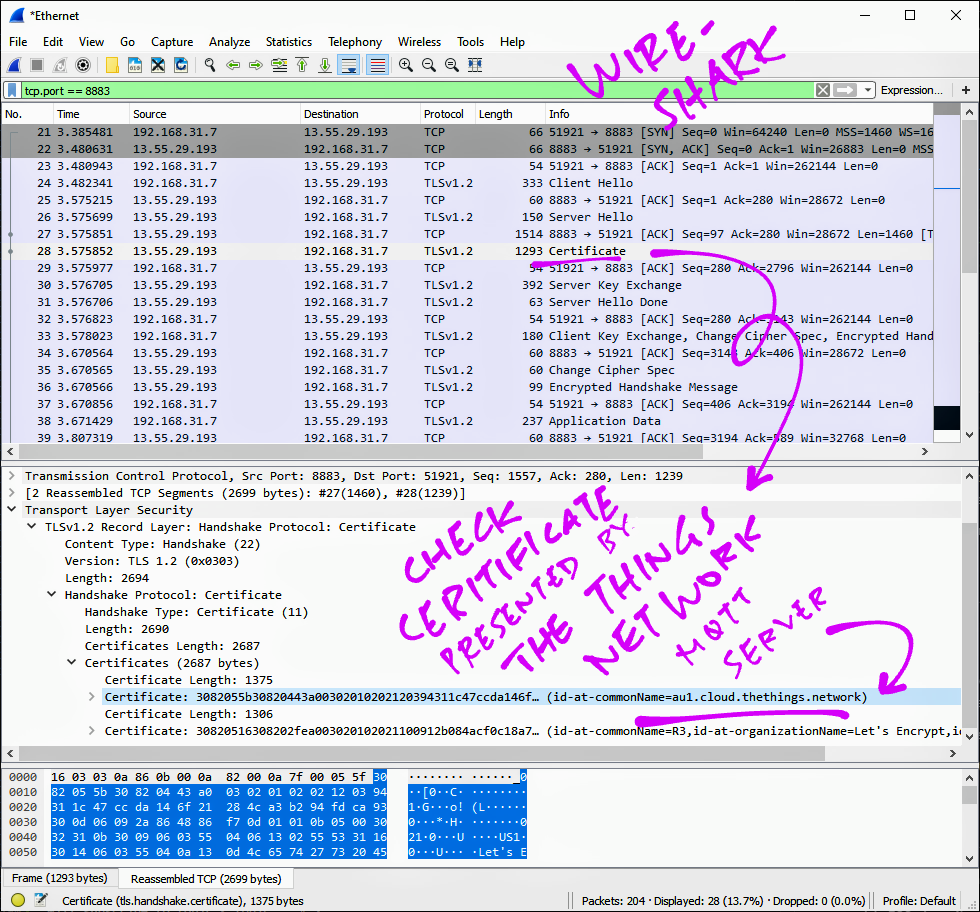
In case of TLS Problems with #TheThingsNetwork MQTT ... Wireshark is our best friend!
https://github.com/lupyuen/prometheus-the-things-network#mqtt-with-tls
For security, we should connect #Prometheus to #TheThingsNetwork MQTT with TLS Encryption ... Here's how
https://github.com/lupyuen/prometheus-the-things-network#mqtt-with-tls
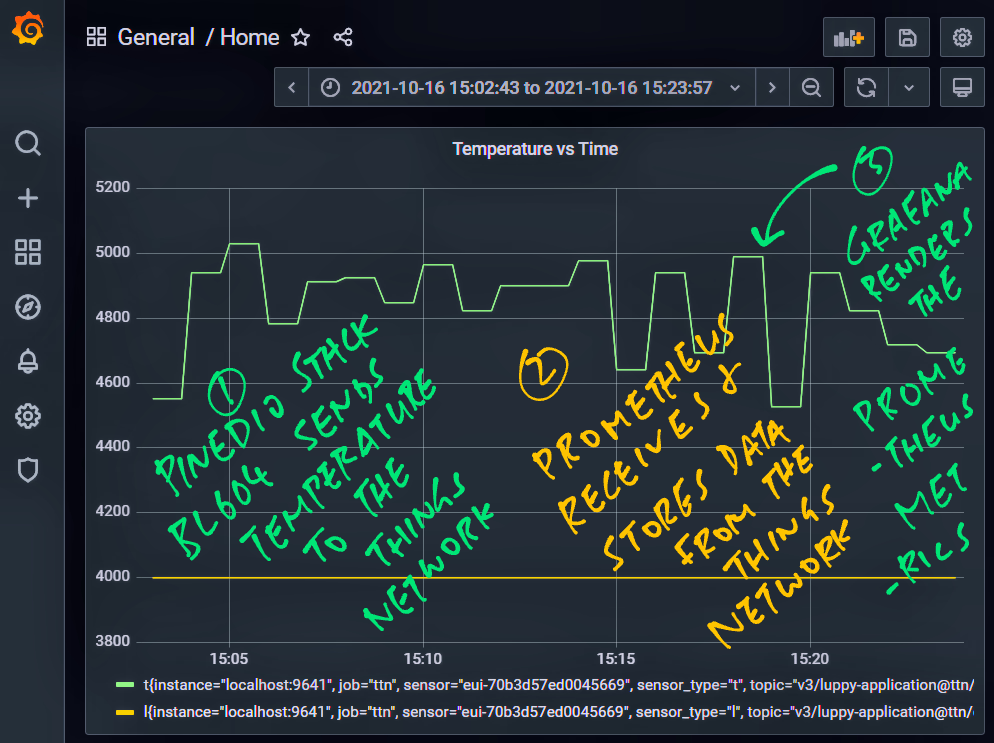
#TheThingsNetwork Sensor Data appears in #Grafana Dashboard ... Thanks to #Prometheus! 🎉
https://github.com/lupyuen/prometheus-the-things-network#configure-grafana
In #Grafana, add a Panel, set the Data Source to #Prometheus and enter the Metric Name (t)
https://github.com/lupyuen/prometheus-the-things-network#configure-grafana
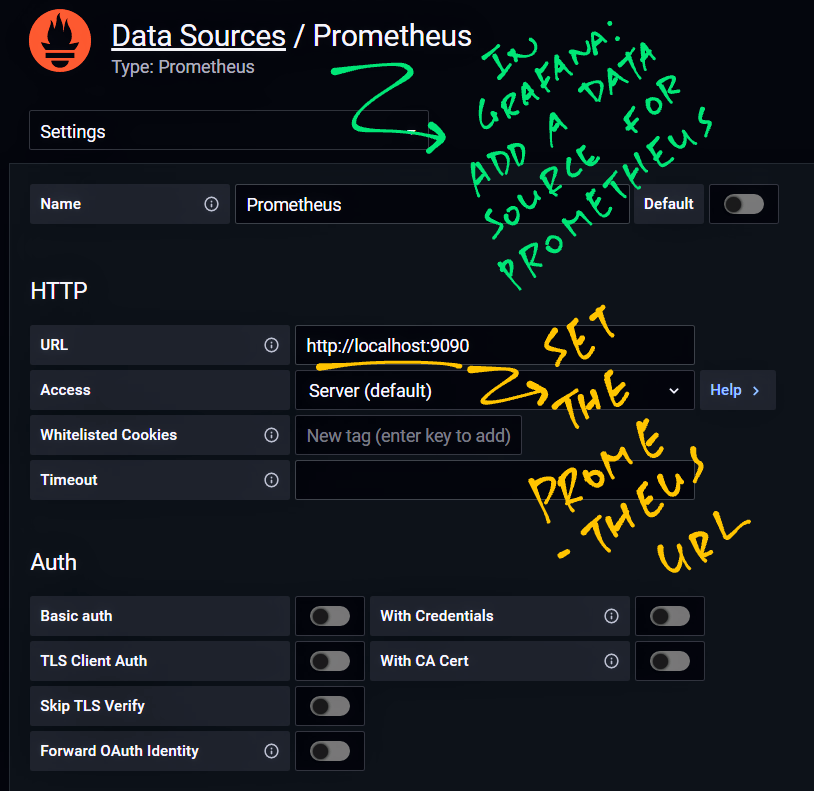
Head over to #Grafana and add a Data Source for #Prometheus (localhost:9090)
https://github.com/lupyuen/prometheus-the-things-network#configure-grafana
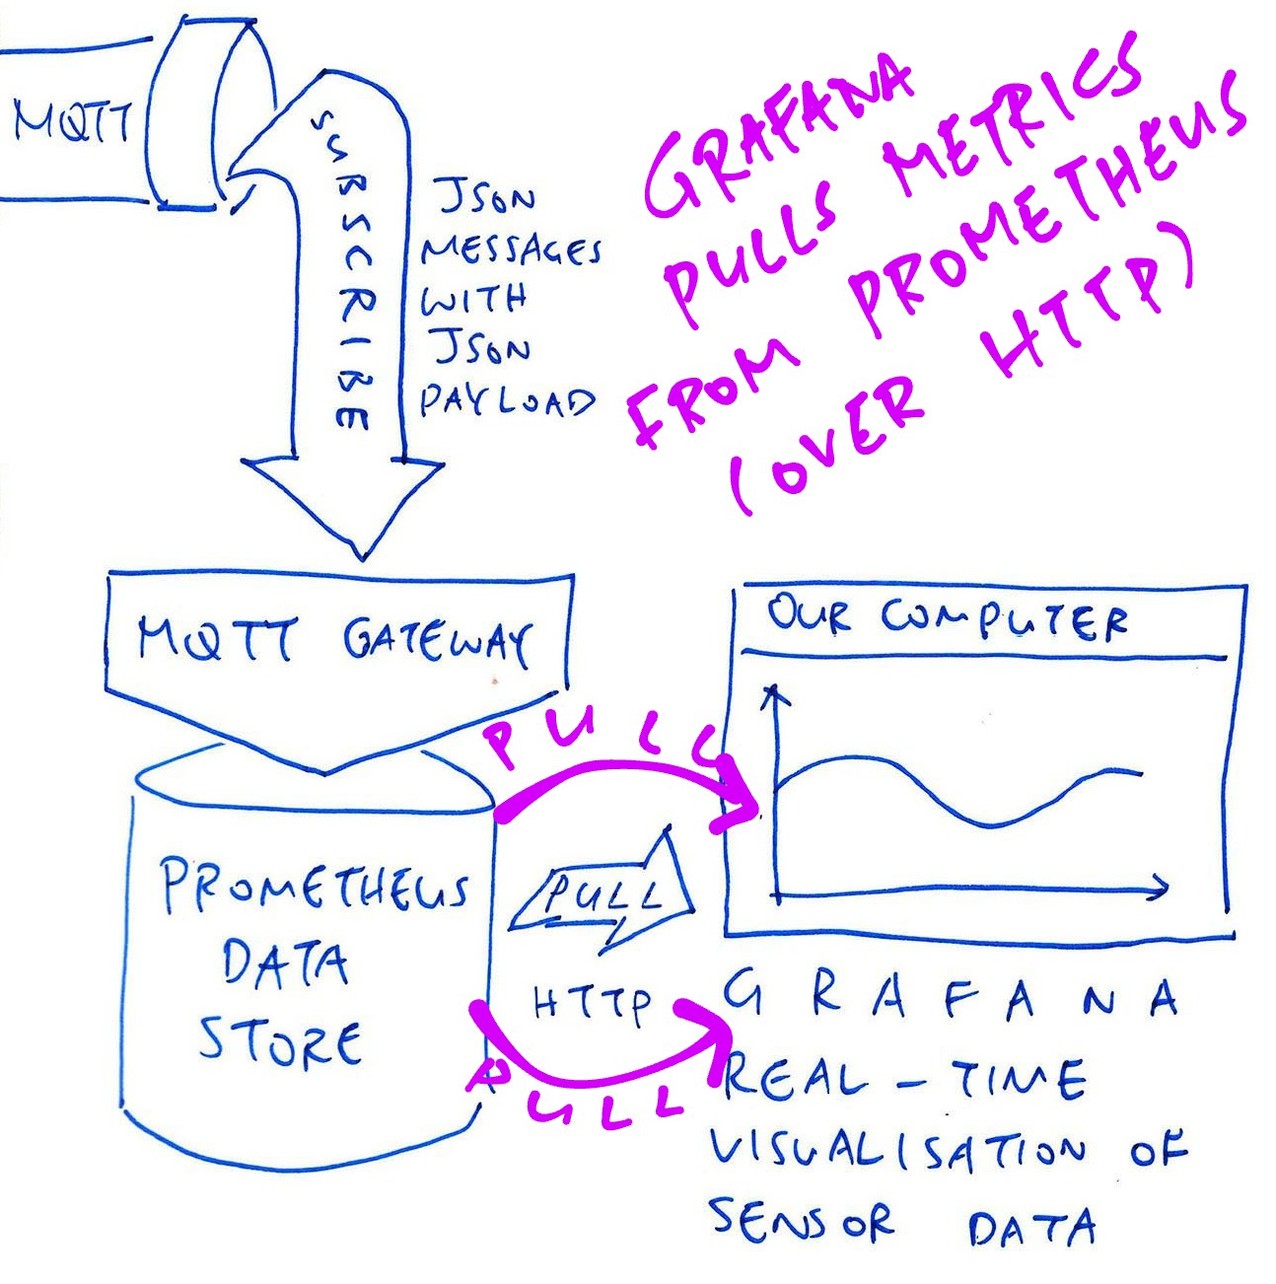
We're ready to connect #Prometheus to #Grafana ... And render our metrics!
https://github.com/lupyuen/prometheus-the-things-network#configure-grafana
To check the scraped metrics in #Prometheus, browse to localhost:9090 and enter the Metric Name (t)
https://github.com/lupyuen/prometheus-the-things-network#configure-prometheus
Every 15 seconds #Prometheus will scrape the metrics from MQTT2Prometheus (via HTTP)
https://github.com/lupyuen/prometheus-the-things-network#configure-prometheus
Now we configure #Prometheus to scrape the metrics from MQTT2Prometheus
https://github.com/lupyuen/prometheus-the-things-network#configure-prometheus
- Pronouns/Gender/Sexuality
- He/Him/They, Bisexual/Asexual 🇸🇬
- Date of Birth
- 1969
- Articles
- https://lupyuen.org
IoT Techie and Educator / Apache NuttX PMC
Joined Jan 2020
