

Robin Lacassin @RobinLacassin@qoto.org
- My IPGP page
- http://www.ipgp.fr/~lacassin
- Tectoldies blog
- https://tectoldies.mystrikingly.com/
Geology, tectonics, earthquakes, seismotectonics, hazard epistemology & sci com.
Senior researcher at Institut de Physique du Globe de Paris (IPGP - CNRS - Univ. Paris Cité). Tektonika DOAJ executive editor.
Joined Nov 2022
Robin Lacassin
boosted

My former PhD student Gino De Gelder has published a beautiful paper on the famed #Huon peninsula, in New Guinea, where Chappell and Shackleton have defined one of the first #Quaternary #eustatic curves ~40 years ago.
Worth reading if you are interested in marine terraces, #geomorphology, sea level variations, #eustasy, #landscape modelling, tectonic uplift, Quaternary #climatechange…
On bad Friday we have refurbished our two iphones for 150€ (2 batteries, 1 screen), thus avoiding wastage. Remember not to renew electronic devices before 5-7 years of use. #sufficiency
Robin Lacassin
boosted

Latest Mauna Loa lava flow map (December 1, 10:30 AM HST).
While the famous #keeling curve record of atmospheric #CO2 is currently interrupted because of #MaunaLoa eruption, listen how Scientists Measure Carbon Dioxide in the Air.
In the linked video, #Scripps scientist Ralph Keeling, the son of Charles David Keeling who started to develop the CO2 measurement at Mauna Loa observatory, explains how the measurement is done. The keeling curve is named from C.D. Keeling.
Related article (link below) in The Guardian: "Hawaii site that measures global CO2 shuts down after Mauna Loa volcano eruption. Scientists scramble to re-establish the crucial monitoring that has been situated on the volcano since 1958"
Amazing #USGS aerial view of the eruption on the northern flank of #MaunaLoa #volcano in #Hawaii. The main erupting fissure shows its high lava fountains in bright yellow. From there anastomosing rivers of fresh lava flow downslope and to the north. Crest and summit of Mauna Kea in the back.
From an USGS video: https://www.usgs.gov/media/videos/november-30-2022-fissure-3-mauna-loas-northeast-rift-zone-continues
Le #CNRS demande désormais à ses chercheurs et chercheuses d’appliquer la stratégie de non-cession des droits d’auteur lors du dépôt de leurs articles auprès d’éditeurs.
Because of the #MaunaLoa eruption and lava flows, the #CO2 measurement equipment that maintains the famous #Keeling Curve lost power on Nov. 28 and is not currently recording data.
Citing their post: "The Keeling Curve is considered the icon of scientific evidence that human activities are altering the planet’s #climate. It has provided incontrovertible evidence that the amount of [atmospheric] gas carbon dioxide has risen far above any levels experienced on Earth for at least three million years […] Researchers at #Scripps Institution of Oceanography, which established the Keeling Curve record at the site in 1958, are exploring options regarding the relocation of measurement equipment."
Lava flows cutting Mauna Loa observatory road (photo USGS)
https://www.usgs.gov/media/images/lava-flow-cutting-mauna-loa-observatory-road
Updated #USGS map of #MaunaLoa eruption and lava flows. Lava flows already cut the road to NOAA observatory.
https://www.usgs.gov/media/images/november-29-2022-mauna-loa-eruption-map
"La baguette de pain française inscrite au patrimoine immatériel de l’humanité par l’Unesco !" 🥖 😋
Robin Lacassin
boosted

Sulfur dioxide (SO2) RGB composition of the 28 Nov 2022 Mauna Loa (Hawaii) eruption from GOESNG -137° geostationary imagery.
Full animation (MP4) here: https://peertube.virtual-assembly.org/videos/watch/3cc8a340-d2a1-4c91-9a61-e578ce9fdc73
Sampling rate: 1 image every 30 minutes.
Source of animation: VolcPlume portal (c) AERIS / ICARE / LOA.
Data: NOAA / SATMOS.
#Hawaii #Volcano #eruption #lavaflow #maunaloa #lava #Geology #GOES #satellite #remotesensing #SO2 #dataviz
Robin Lacassin
boosted

For those wondering today why locating a #CO2 observational #station on a flank of an active #MaunaLoa volcano:
1. It is remote from major pollution sources and located at a hight of 3.4 km above sea level - a perfect spot for sampling background air in the well mixed free #troposphere.
2. It is easily accessible and has a good local infrastructure.
3. It is also the longest #record of #volcanic CO2 observations.
A win-win situation for #science 😀
Robin Lacassin
boosted
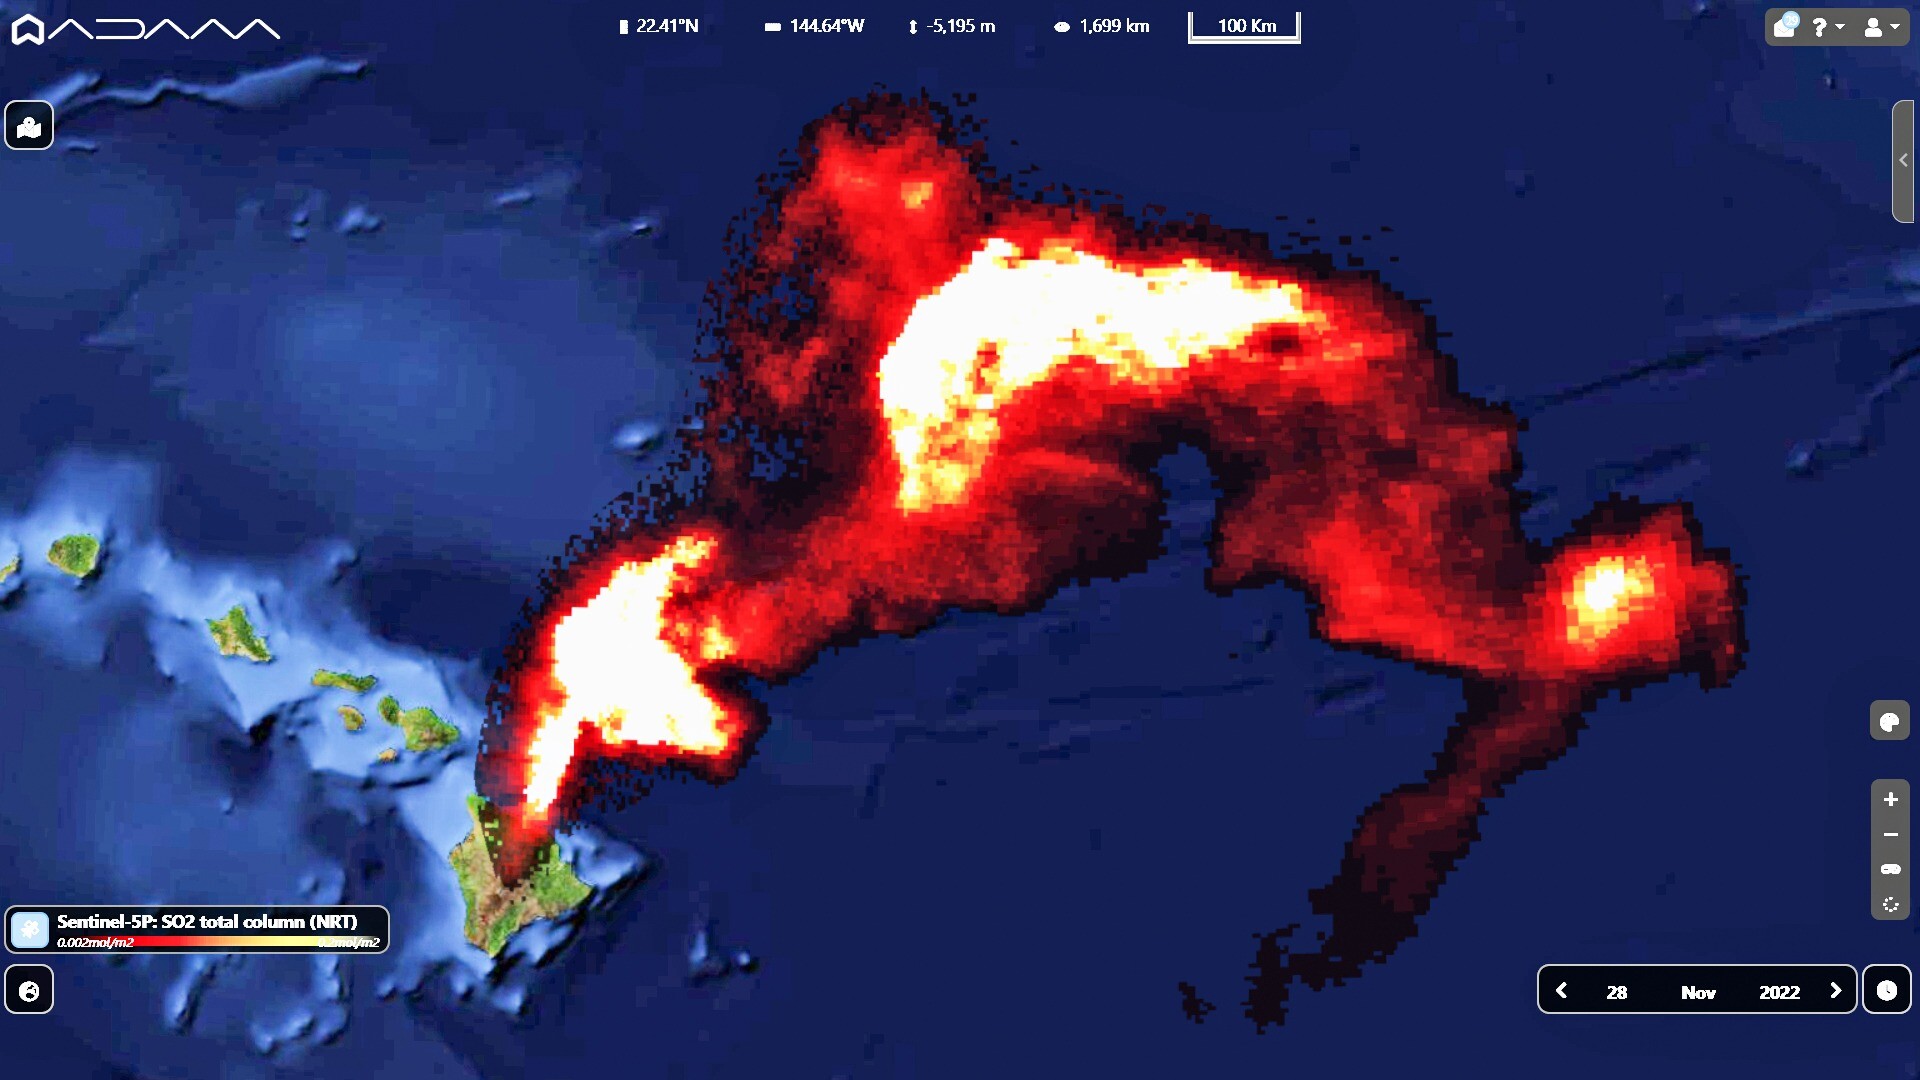
Mauna Loa eruption: massive SO2 (sulfur dioxide) plume imaged by Sentinel-5P TROPOMI.
Maximum = 200 DU close to the source.
Total estimated SO2 mass > 100 kton (#USGS reports a flux of "250 kton / day SO2").
Image acquired around 22:00 UTC on 29 Nov.
Source: VolcPlume portal (c) AERIS / ICARE / LOA https://www.aeris-data.fr/le-projet-volcplume-une-plateforme-unique-pour-le-suivi-et-lanalyse-4d-des-panaches-volcaniques/
#Hawaii #Volcano #eruption #lavaflow #maunaloa #lava #Geology #TROPOMI #satellite #Sentinel5P #remotesensing #SO2 #dataviz
Robin Lacassin
boosted

The first eruption of #MaunaLoa volcano since 1984 from space.
#Copernicus #Sentinel5p #Tropomi detected on Nov. 28th the large SO2 plume moving eastward.
#Hawaii #Volcano #volcaniceruption #AirQuality
@Bewickwren
@m_parrington @ai6yr @sydonahi
@CosmicRami @RobinLacassin
@ewklemetti
Correction: as @culturevolcan pointed out, this is NOT the northeastern rift zone, but the southwestern volcano flank.
Citing: "This picture shows in fact a portion of the initial eruptive fracture cutting the upper South-West flank. Mostly gaz release a a few short lava flows there berfore the magma was drained by the North-East Rift Zone"
Looking carefully to the background you may see the South Pit and two small rounded volcanoes that are located SW of the main caldera.
Another excellent view of the #MaunaLoa upper northeastern rift zone with the active erupting fissure in the foreground. The summit caldera is in t...
Another excellent view of the #MaunaLoa upper northeastern rift zone with the active erupting fissure in the foreground. The summit caldera is in the back.
Reminder, USGS public domain aerial images are here: https://www.usgs.gov/observatories/hvo/news/photo-and-video-chronology-hawaiian-volcano-observatory-november-28-2022
Beautiful aerial views of the #MaunaLoa eruption by the #USGS Hawaiian #Volcano Observatory are here: https://www.usgs.gov/observatories/hvo/news/photo-and-video-chronology-hawaiian-volcano-observatory-november-28-2022. These USGS images are public domain.
On this image 👇🏼 , the erupting fissure with lava fountains is visible to the upper left. From the fissure reddish lava flows downslope.
- My IPGP page
- http://www.ipgp.fr/~lacassin
- Tectoldies blog
- https://tectoldies.mystrikingly.com/
Geology, tectonics, earthquakes, seismotectonics, hazard epistemology & sci com.
Senior researcher at Institut de Physique du Globe de Paris (IPGP - CNRS - Univ. Paris Cité). Tektonika DOAJ executive editor.
Joined Nov 2022
