

Robin Lacassin @RobinLacassin@qoto.org
- My IPGP page
- http://www.ipgp.fr/~lacassin
- Tectoldies blog
- https://tectoldies.mystrikingly.com/
Geology, tectonics, earthquakes, seismotectonics, hazard epistemology & sci com.
Senior researcher at Institut de Physique du Globe de Paris (IPGP - CNRS - Univ. Paris Cité). Tektonika DOAJ executive editor.
Joined Nov 2022
Robin Lacassin
boosted

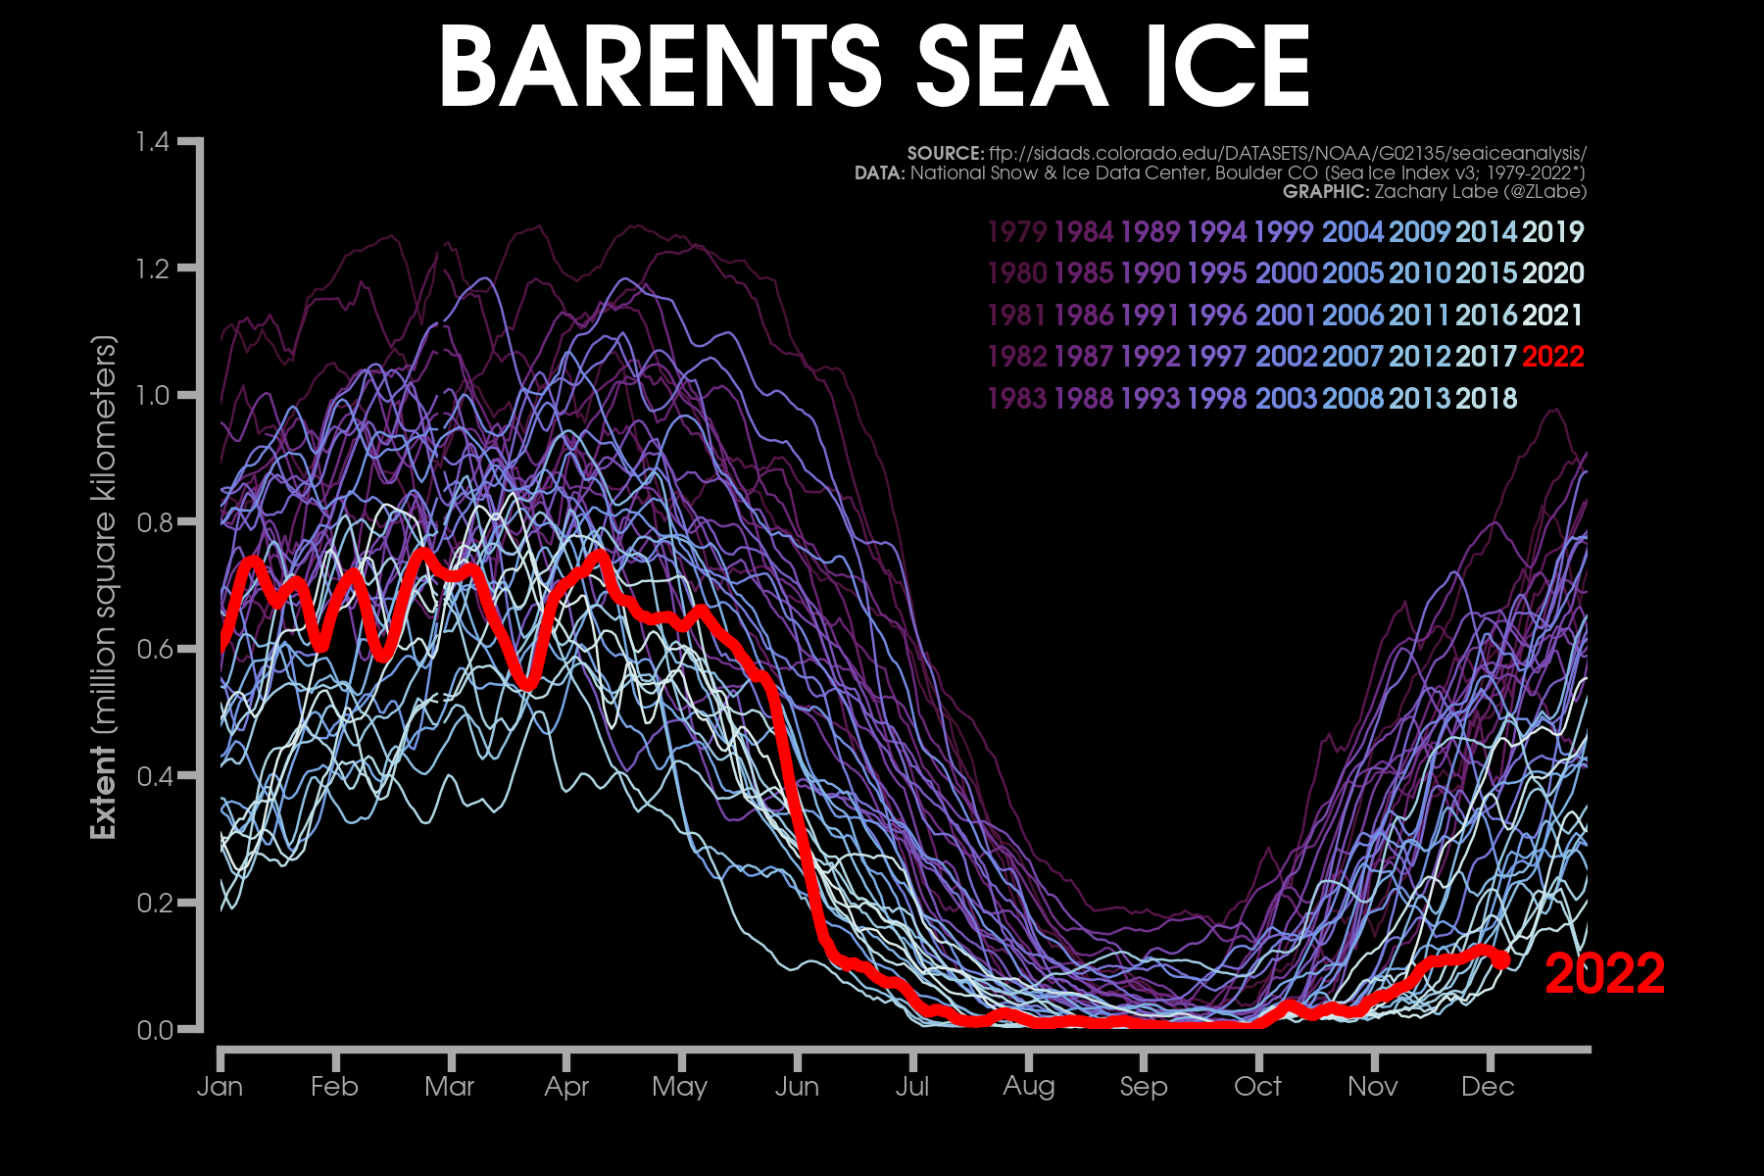
Just hardly any growth of #Arctic sea ice in the Barents Sea so far this cold season...
Compare the differences between the 1980s (purple lines) and last decade (white lines)... 😅
+ Data from: https://nsidc.org/data/seaice_index
+ Map of this region: https://zacklabe.files.wordpress.com/2022/08/b203f-nsidc_mapseas.png
Robin Lacassin
boosted

Excited to be handling my first editorial assignment for @wearetektonika. Hoping the reviewers will also be enthusiastic about contributing to the community and to truly free and open #science. #tectonics #StructuralGeology #OpenScience #doaj
Our paper on the #tectonics of this very remote area 👇🏼 in the #Atacama #desert is finally accepted for publication in EGU Solid Earth (will be Habel et al. 2022).
I'll say more when the article is online 😉
#geologist at work, #landscape of the #Andes #mountains
On 4 December, at 15:19 UTC, a strong #pyroclastic flow along the Sciara del Fuoco on #Stromboli #volcano reached the sea and generated a moderate #tsunami, hopefully not causing damage (according to INGV). Tide gauge in Ginestra recorded it with a delay of only a few minutes, and crest to crest amplitude of ~60cm.
Stromboli is an Italian very active volcano from the Aeolian islands in the Tyrrhenian sea (Mediterranean). Its activity, and more particularly hazards due to the pyroclastic flows, are monitored by INGV.
INGV reported about the tsunami: https://ingvterremoti.com/2022/12/05/stromboli-4-dicembre-2022-tsunami-si-o-tsunami-no/
And about the volcanic event itself: https://ingvvulcani.com/2022/12/05/cosa-e-successo-a-stromboli-il-4-dicembre-2022/
Robin Lacassin
boosted

Sulfur dioxide (SO2) plume emitted by #maunaloa #volcano continues to spread above North America.
Images acquired on 02 and 03 Dec 2022.
#Hawaii #Volcano #eruption #lavaflow #maunaloa #lava #Geology #TROPOMI #Copernicus #Sentinel5P #so2 #satellite #remotesensing
Robin Lacassin
boosted

My former PhD student Gino De Gelder has published a beautiful paper on the famed #Huon peninsula, in New Guinea, where Chappell and Shackleton have defined one of the first #Quaternary #eustatic curves ~40 years ago.
Worth reading if you are interested in marine terraces, #geomorphology, sea level variations, #eustasy, #landscape modelling, tectonic uplift, Quaternary #climatechange…
On bad Friday we have refurbished our two iphones for 150€ (2 batteries, 1 screen), thus avoiding wastage. Remember not to renew electronic devices before 5-7 years of use. #sufficiency
Robin Lacassin
boosted

Latest Mauna Loa lava flow map (December 1, 10:30 AM HST).
While the famous #keeling curve record of atmospheric #CO2 is currently interrupted because of #MaunaLoa eruption, listen how Scientists Measure Carbon Dioxide in the Air.
In the linked video, #Scripps scientist Ralph Keeling, the son of Charles David Keeling who started to develop the CO2 measurement at Mauna Loa observatory, explains how the measurement is done. The keeling curve is named from C.D. Keeling.
Related article (link below) in The Guardian: "Hawaii site that measures global CO2 shuts down after Mauna Loa volcano eruption. Scientists scramble to re-establish the crucial monitoring that has been situated on the volcano since 1958"
Amazing #USGS aerial view of the eruption on the northern flank of #MaunaLoa #volcano in #Hawaii. The main erupting fissure shows its high lava fountains in bright yellow. From there anastomosing rivers of fresh lava flow downslope and to the north. Crest and summit of Mauna Kea in the back.
From an USGS video: https://www.usgs.gov/media/videos/november-30-2022-fissure-3-mauna-loas-northeast-rift-zone-continues
Le #CNRS demande désormais à ses chercheurs et chercheuses d’appliquer la stratégie de non-cession des droits d’auteur lors du dépôt de leurs articles auprès d’éditeurs.
Because of the #MaunaLoa eruption and lava flows, the #CO2 measurement equipment that maintains the famous #Keeling Curve lost power on Nov. 28 and is not currently recording data.
Citing their post: "The Keeling Curve is considered the icon of scientific evidence that human activities are altering the planet’s #climate. It has provided incontrovertible evidence that the amount of [atmospheric] gas carbon dioxide has risen far above any levels experienced on Earth for at least three million years […] Researchers at #Scripps Institution of Oceanography, which established the Keeling Curve record at the site in 1958, are exploring options regarding the relocation of measurement equipment."
Lava flows cutting Mauna Loa observatory road (photo USGS)
https://www.usgs.gov/media/images/lava-flow-cutting-mauna-loa-observatory-road
Updated #USGS map of #MaunaLoa eruption and lava flows. Lava flows already cut the road to NOAA observatory.
https://www.usgs.gov/media/images/november-29-2022-mauna-loa-eruption-map
"La baguette de pain française inscrite au patrimoine immatériel de l’humanité par l’Unesco !" 🥖 😋
Robin Lacassin
boosted
Sulfur dioxide (SO2) RGB composition of the 28 Nov 2022 Mauna Loa (Hawaii) eruption from GOESNG -137° geostationary imagery.
Full animation (MP4) here: https://peertube.virtual-assembly.org/videos/watch/3cc8a340-d2a1-4c91-9a61-e578ce9fdc73
Sampling rate: 1 image every 30 minutes.
Source of animation: VolcPlume portal (c) AERIS / ICARE / LOA.
Data: NOAA / SATMOS.
#Hawaii #Volcano #eruption #lavaflow #maunaloa #lava #Geology #GOES #satellite #remotesensing #SO2 #dataviz
Robin Lacassin
boosted

For those wondering today why locating a #CO2 observational #station on a flank of an active #MaunaLoa volcano:
1. It is remote from major pollution sources and located at a hight of 3.4 km above sea level - a perfect spot for sampling background air in the well mixed free #troposphere.
2. It is easily accessible and has a good local infrastructure.
3. It is also the longest #record of #volcanic CO2 observations.
A win-win situation for #science 😀
- My IPGP page
- http://www.ipgp.fr/~lacassin
- Tectoldies blog
- https://tectoldies.mystrikingly.com/
Geology, tectonics, earthquakes, seismotectonics, hazard epistemology & sci com.
Senior researcher at Institut de Physique du Globe de Paris (IPGP - CNRS - Univ. Paris Cité). Tektonika DOAJ executive editor.
Joined Nov 2022
