

🎓 Doc Freemo  🇳🇱
@freemo@qoto.org
🇳🇱
@freemo@qoto.org
- UFoI Member
- http://UFoI.org/u/freemo/
- Website
- http://JeffreyFreeman.me
- Gitlab
- https://git.qoto.org/freemo
Admin
Jeffrey Phillips Freeman
Innovator & Entrepreneur in Machine Learning, Evolutionary Computing & Big Data. Avid SCUBA diver, Open-source developer, HAM radio operator, astrophotographer, and anything nerdy.
Born and raised in Philadelphia, PA, USA, currently living in Utrecht, Netherlands, USA, and Thailand. Was also living in Israel, but left.
Pronouns: Sir / Mister
(Above pronouns are not intended to mock, i will respect any persons pronouns and only wish pronouns to show respect be used with me as well. These are called neopronouns, see an example of the word "frog" used as a neopronoun here: http://tinyurl.com/44hhej89 )
A proud member of the Penobscot Native American tribe, as well as a Mayflower passenger descendant. I sometimes post about my genealogical history.
My stance on various issues:
Education: Free to PhD, tax paid
Abortion: Protected, tax paid, limited time-frame
Welfare: Yes, no one should starve
UBI: No, use welfare
Racism: is real
Guns: Shall not be infringed
LGBT+/minorities: Support
Pronouns: Will respect
Trump: Moron, evil
Biden: Senile, racist
Police: ACAB
Drugs: Fully legal, no prescriptions needed
GPG/PGP Fingerprint: 8B23 64CD 2403 6DCB 7531 01D0 052D DA8E 0506 CBCE
Joined Jul 2018
🎓 Doc Freemo 🇳🇱
boosted
@sergiopantalone These are all excellent questions and before I answer them I want to point out one thing, and please dont take this personally...
Consider your biases for a minute and how overwhelmingly obvious the conclusion should be , even without a full statistical deep-dive, that the protests should be quite obvious to any casual observer that it is the obvious cause.. ignoring the technical arguments consider the following
1)Memorial day is easily ruled out for several reasons
* most notably cases continued to drop for 16 days after memorial day, if this were to blame, given it was a nationwide event, we would see Generation one in 5 days and the onset of the curve, which didnt happen until more than 3 times that period
* While the relative change % might not be consistent the onset of the curve would be consistent across states if the triggering event could be traced to a single day.
* There were no large public gatherings due to coronavirus, so that means at best smaller gatherings were to blame.. obviously small gatherings are far less likely to be an integrating factor than mass protests crowded shoulder to shoulder in many cases in the street.
2) 4th of july is easily ruled out as well, it doesnt even occur until the peak is well underway and the generational period of 5 days would put the first cases at the 9th of july. By this point the curve stopped increasing and it leveled off, thus clearly ruling this out. also the above points for memorial day apply.
3) But more importantly.. seriously... we know and have been told countless times that even small gatherings are a huge risk factor for viral spread, we were discouraged to even have friends over in our home, and even in the supermarket to not be anywhere near eachother... Can you honestly tell me you are adamant about looking for alternative explanations when we literally jam packed ourselves shoulder to shoulder in the streets in every major city for days on end, with no other obvious candidates for a cause, like is this even something that should need to be proven in this level of detail.
All that said let me get back to your more specific questions... how did I rule out spurious relationships...
> The only other thing I'm curious about is the steps you took to rule out spurious relationships. You said you normalized for population, but what about population density?
Well I stated that already for all the spurious relationships you have so far been able to propose as possible alternatives. But more importantly and more generally, the methodology used to analyze peak shifts to identify ground zero is a particularly effective method that is naturally much more resistant to spurious causes than other forms of analysis (such as simply looking at relative size of peaks).. th reason for this is when we see all of the cities with significant protests have significant left hand shifts that would mean the only way we could see that pattern due to a different effect is if there was some other event that was unique to **only** those cities and occuring on the same date as the onset of the protests, and which did not occur in other cities or occured 4 weeks later. That is a very unlikely scenario indeed.
For example consider if we saw that all the cities that I mentioned as the top candidates all happened to be cities that had the least public use of facemasks... even that would not explain the data observed because the only way that would work is if everyone in the city had suddenly stopped using facemasks the day the protests started, and then for some odd reason started using them again 2 weeks later.
Long story short this particular type of analysis for diseases factors simply cant be explained away very easily by spurious events without a pretty big coincidence.
> You said you normalized for population, but what about population density?
While I did check against normalized data for population density, this was more out of curiosity on my part than due it being a valid approach in this case. specifically because population density is already baked into the underlying numbers I used during my analysis (which is typical in this type of analysis). In each case I used local state R numbers, keep in mind generation time is not effected by population density, only the R numbers are. Since the R numbers are derived as a baseline, and do not fluctuate as a disease progresses without some other factor playing a role (like a sudden use of masks).
Also keep in mind R numbers are far more precise than normalizing direct to population density as we do not know how individuals will move around.. some people will be protesting in their home city and simply local to the area, but many others will travel from nearby areas to join the protest and then bring the disease back. In all cases we would expect the local R number to hold true and be the **conservative** value, since a protest would, if anything, cause the R number to increase due to having a much higher density of people than normal.
So yes population density is accounted for.
> Also, how did you take into account the dates of states reopening bars, restaurants and gyms?
I checked as best I could find the covid reopening schedule in several states, in fact i even posted it as a list sometime back on an earlier covid analysis I did (I will have to find it).. In order for a reopening to explain the events seen it would have had to have happened across all the top states that showed a left hand shift, so basically there would have to be changes in covid policy across half a dozen or more states all within just a few days of eachother (remember the generational period is only 5 days) to be able to explain these events. That was not the case here.
> Did you factor in weather or tourism
I did not factor in weather or tourism, nor do I see how I would or how this could effect it. Again there would need to be a sudden change in weather occuring within a window of only a few days for it to be able to explain the sudden onset, which of course is not the case here, a rainy day or something isnt going to cause something like this.
As for tourism, its possible, but do you know of any tourism events that simultaneously affected the 5 states i listed all on the same day and didn't effect other states. Unless you want to count the protests itself as a tourism event that is significantly higher than baseline I cant imagine how anything like that could or would be considered.
> I know you're using proprietary software but methodology is really important when making such bold claims.
To me saying "hey mass gatherings on an order of magnitude we havent seen in many years, and on a scale we just havent really seen in a long time, is likely the cause"... .especially saying that when every top professional had told us for many months prior "Even small gatherings will make this virus unmanageable, dont do" is not by any measure a "bold claim"... to me the claim is obvious, not even questionable really given how viruses work.. there shouldnt even be a need for me to do the level of rigour I did... So you might ask why I did it... simple people, even news papers, were making excuses left and right as to why the protests werent a bad thing WRT coronavirus.. to me this was just silly and obviously untrue, but it is hard to fight against the lies people tell themselves. This was a good cause so people are very eager to lie to themselves to try to find an excuse for it. So I felt given the amount of public sentiment that that was the case, and always being willing to question my own bias, no matter how obvious it might be, I decided to do a deep dive on the numbers and see if the numbers agreed with my own common sense judgement, of the doubts of others... Obviously you know my conclusion.
🎓 Doc Freemo 🇳🇱
boosted

@freemo Thank you for the insight into your process, and for taking the time to share it. The only other thing I'm curious about is the steps you took to rule out spurious relationships. You said you normalized for population, but what about population density? Also, how did you take into account the dates of states reopening bars, restaurants and gyms? Did you factor in weather or tourism? I know you're using proprietary software but methodology is really important when making such bold claims.
🎓 Doc Freemo 🇳🇱
boosted
@freemo Thank you for your response and your patience. I don't mean to make assumptive leaps. My alternate hypothesis that it coincides with national holidays would also account for the propagation curve and the fact that it's not mirrored in other countries. I don't have access to your methodology for the varying cities (it was the chart that caught my eye) but I would like to know more about it. Again, thanks.
🎓 Doc Freemo 🇳🇱
boosted
Since I am working off of some proprietary tools it would be hard to give a complete copy of my work (and i do understand why that would make you more critical, as it should).. but I think i can relate the state-by state findings in a less rigerous way to at least illustrate the connection.
First though let me point out that your pointing to memorial day is very easily ruled out due to the generation time of the virus. It simply does not line up with the curve. Bhile the very first protests of any kind did start around the same time as memorial day, they were not particularly significant in number. If you look at a time line of protests and as they developed it wasnt until june 14th that the bulk of the protests from a nationwide perspective began. The date of memorial day is simple too soon to match the date, due to the generational time if that were an instigating factor cases would be observed increasing earlier than we saw when in fact they continued to decrease. However the generational time does match the life of the protests almost exactly as expected.
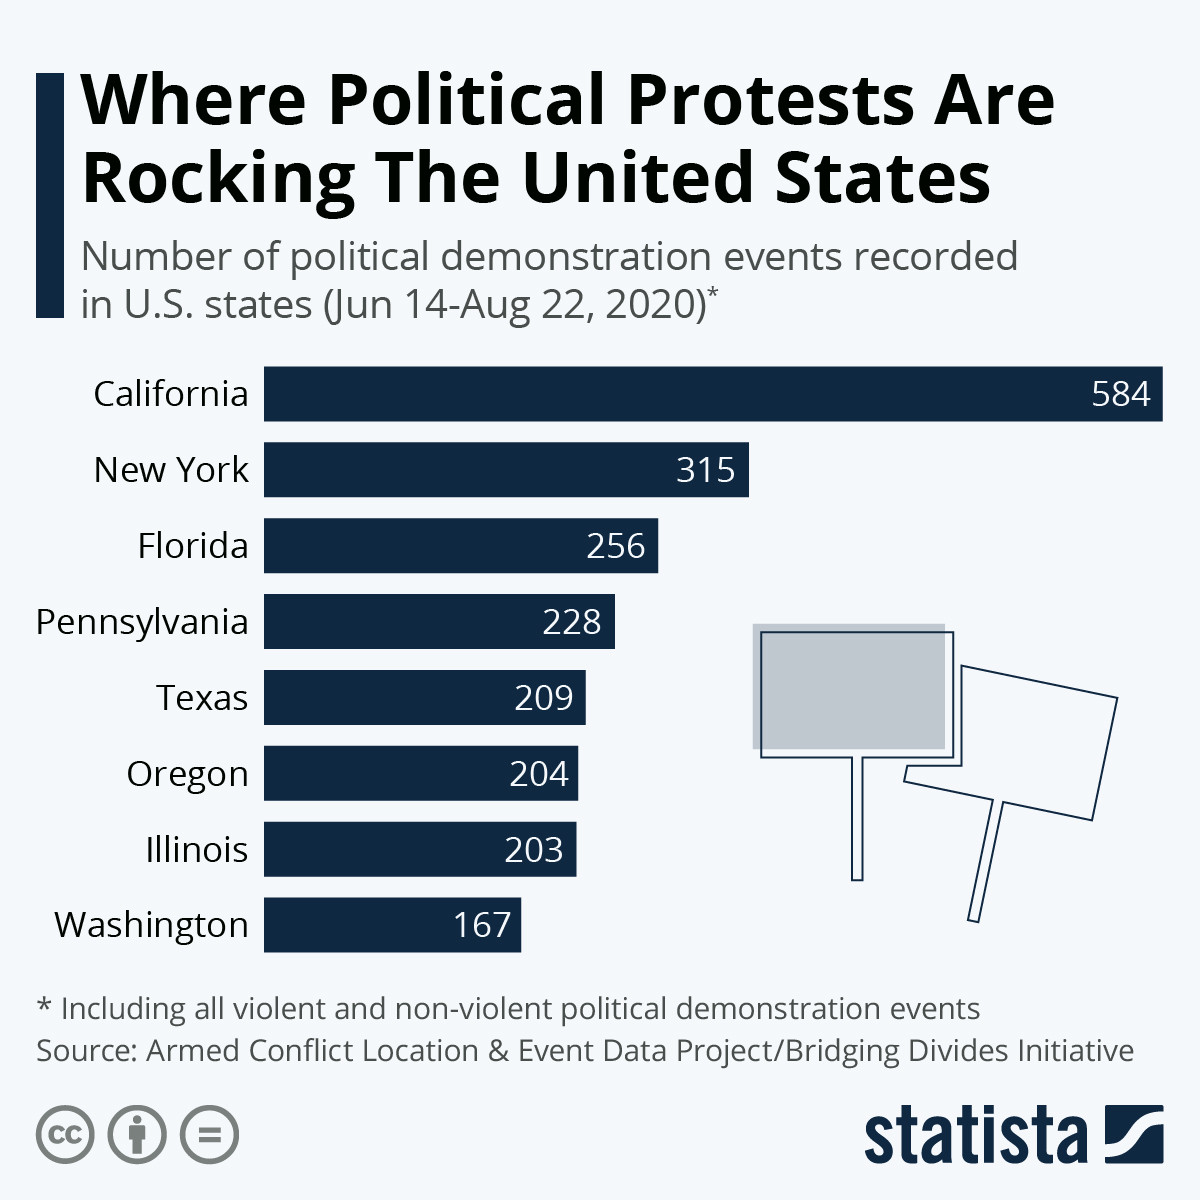
So next ill try to pull some images for this conversation. Keep in mind I didnt generate these images nor did i check their specific numbers. But they are fairly in line with the data source I used and look close enough to accurate to be useful for illustrative purposes here.
So first look at the attached image. As you can see California, New York Pennsylvania, florida were the places that had the biggest (as well as the largest) number of protests. This roughly aligns with my own data set. Of those five all but oregon had acceptable testing programs to pull from.
As would confirm my hypothesis all of the top 5 states show significant peaks at the expected time period to conclude it was due to protests.
In fact even if you normalize the cases for the population density and overall population they correlate very closely with the states that had the most protests. but more importantly when looking at this is looking at the time shift on their peak cases once rising on the graph. One would expect (and the data agrees) that states where the first generational cases begin for the resurgence will have their peak time shifted to the left, states that see secondary effects will have the peak shifted to the right.
As to be expected this lines up with the data also. New york for example had a 34% increase in cases from baseline during its peak and had its peak shifted to the left significant with a very sharp rise time, indicative of a ground zero event. The onset for the rise to begin was june 19th, exactly the generational period from the beginning of major protest events in the city of june 14th/15th reaching its initial. From first generation on june 15th we saw an increase in case count in new york of 34% over the next 19 days, which is one of the earliest onsets we see among states.
California shows a similar pattern of early onset, quick rise to peak, and significant relative change. In this case the initial onset of the peak and first generational symptoms was June 16th reaching its maximal peak on July 8th. California showed a 509% increase in relative case count in only about 22 days.
Floridas peak was July 13, with an over baseline rise of 1200%. and so on
In all these cases the peak of the spike was at least 2 weeks **sooner** than the national average, bearing in mind these states make up the bulk of that average as they, along with the other top ranking states that show similar patterns, have the bulk of the cases contributing to the spike. This pattern that the earliest onset of peak is only seen in states with significant protests and in fact in states where there were no significant protests the peak was very minimal to the point of almost not being present.
It is important to note when looking at other states many didnt have noticable spikes at all, but more important, where spikes were present they were time shifted significantly to the right of the mean by 2 weeks or more int he other direction. This suggests that while they did have cases result from the protests they were likely improted from other states and thus had a much smaller generation-0 which would be described and manifested as a delayed peak, exactly as we see it.
Moreover many of the states where we see delayed peaks but where the peaks are still noticeable are states in close proximity to states that have heavy protests. suggesting this was likely people commuting across state lines to protest and then bringing the disease back with them to their home state.
There are 2 kinds of people: those stupid enough to put people into 2 categories, and those that aren't.
So I just crunched the numbers on this post. Presuming that the protests caused the bump I pointed out in cases and deaths, and presuming the large peak at the right was provoked by some other cause, then the george floyd protests were directly responsible for killing 56,982 people, and were responsible for infecting 6,087,567 people. This is minimum, since the numbers were on the decline before the protests, and declined after the protests as well, this suggests the real numbers might even be as high as double that.
While I certainly support the idea that the George Floyd killing was wrong, and we need police reform. I can not justify the the protests or the consequences we are still suffering from it. Certainly not the **death of 57,000 people!**
#COVID #COVID19 #Corona #Coronavirus #BLM #Protest @Science #GeorgeFloyd #CivilJustice #Defundthepolice #PoliceBrutality
Just wanted to share a little chart showing the likely effect of the mass BLM protests over George floyd compared to the COVID-19 recorded new case...
🎓 Doc Freemo 🇳🇱
boosted
If you do not include the EM radiation caused by inductive coupling of the filament with its environment (which is fairly small) then it is just a hair under 2%. Bear in mind this is radiative flux, so it doesn't account for the sensitivity of the eye to certain wavelengths.
🎓 Doc Freemo 🇳🇱
boosted

Just wanted to share a little chart showing the likely effect of the mass BLM protests over George floyd compared to the COVID-19 recorded new cases count.
To be clear, I think Floyd's death was an injustice and I support the idea of opposing it at every level. But it was the number one biggest factor that caused the COVID epidemic to resurge out of control and we never recovered from the surge seen during the protest and even now this new surge we are seeing is partially fueled by the effects of those protests.
The irony here is the left have been the most vocal about COVID and blamed Trump for not seeing enough success in battling it as a central point in their entire presidential debate... yet they are also the ones who caused more loss of life and a more prolific spread of the diseases than anyone else when it served their agenda, and had the gall to try to blame that on Trump or republicans.
After seeing months of liberals abusing old ladies grocery shopping without a mask on and the like it is pretty disgusting, though typical, to see they are also the ones who caused more a problem than anyone else.
@ravenclaw Thanks for your report, account suspended.
🎓 Doc Freemo 🇳🇱
boosted

The thing about bravery is, if you are just pretending to be brave, then you are more brave, not less :)
🎓 Doc Freemo 🇳🇱
boosted

@freemo @noellabo It's my proud if you merge my code, but I have no computer currently to creat pull request. So you may cherry-pick from my repo directly (≧▽≦)
Here are commit trees for adding translation button:
https://github.com/mashirozx/mastodon/commit/f883ef595bbd7b0e2249e6a47144de137fd26a68
https://github.com/mashirozx/mastodon/commit/f4c5634d85cbab96c46845471eb12bb40654df13
https://github.com/mashirozx/mastodon/commit/15d86534e07012fc6d8424ec6da92c65a5eb9eeb
https://github.com/mashirozx/mastodon/commit/0ac43d937823d0a9ac21545622ad3c71d15a5cb5
https://github.com/mashirozx/mastodon/commit/2a5e159256de4539c1a8d74b1039eb5cc7959fc9
https://github.com/mashirozx/mastodon/commit/9052f004a809bf813d496140c11cf9c79566d8a7
https://github.com/mashirozx/mastodon/commit/ecbdd478bfde5de809610f815cfda1d00aaee712
And the backed of the translation service is here:
🎓 Doc Freemo 🇳🇱
boosted

Might benefit from a discussion of why `nCk = n!/(k!(n-k)!)`. I don't use combinatorics often enough to have it memorised, so I re-derive the `nCk` and `nPk` formulae every time I need them. Here's my reasoning:
- If you want to arrange `n` objects, you can choose any of `n` for the first, any of the `n-1` remaining for the second, ... down to one for the `n`th. So n objects can be arranged in `n! = n(n-1)...1` ways.
- If you want to choose `k` of `n` objects, you can do this by ordering the `n` objects and taking the first `k`. So initially `nCk = n!`
- However, you don't care about ordering of the chosen objects. If you choose two of `{1, 2, 3, 4}`, the orderings `{1, 2, 3, 4}` and `{2, 1, 3, 4}` should not be treated as distinct. Since there are `k!` ways to order the `k` objects you chose, you need to divide that out. Now we have `nCk = n!/k!`
- Equally, you don't care about ordering of the non-chosen objects. In the above example, `{1, 2, 3, 4}` and `{1, 2, 4, 3}` should not be treated as distinct. There are `n-k` of these objects, so `(n-k)!` ways to order them, which again should be divided out. Finally, we arrive at `nCk = n!/(k!(n-k)!)`
In case anyone is curious as to how to do some elementary statistics, in this case combinatorics, here is a quick little write up I did to explain the "n choose k" paradigm.
Here is the is the question (from my cousin):
> Math people
Can you help me ??
Let's say
Hypothetically
You have 7 numbers
Between 1-99
The first 6 cant repeat but the 7th can
How many outcomes are possible?
This isnt a riddle or anything I just dont know how to do the math on something I'm trying to figure out
Here is my answer:
I find ones mental health is directly proportional to ones comfort with silence.
When I am not in as healthy a mental state, just some stress or whatever, nothing too significant, I find silence, particularly at the end of the day, as very uncomfortable, almost has a depressing feel to it. But if i keep music or the TV on, even in the distance without watching it that goes away.
But when i am in a healthier place I rarely even notice the silence and when I do it can be relaxing and soothing.
Is this just me?
## How Money is created
#### Monetary & Quantitative Easing
Yesterday I posted this diagram, but it had some significant errors in it. I have since corrected it and wanted to share the new version. Enjoy.
So I created this diagram showing what Quantitative Easing and Monetary Easing is and more generally how new money is created and put into circulation, thus increasing the money supply.
#Money #USPol #Economics #Economy #Investing #QuantitativeEasing #MonetaryEasing #TheFed @General
🎓 Doc Freemo 🇳🇱
boosted
"If everyone jumped off a bridge would you too?"...."
Of course! Clearly they know something I dont. There is probably money or horny women at the bottom of that bridge!
- UFoI Member
- http://UFoI.org/u/freemo/
- Website
- http://JeffreyFreeman.me
- Gitlab
- https://git.qoto.org/freemo
Admin
Jeffrey Phillips Freeman
Innovator & Entrepreneur in Machine Learning, Evolutionary Computing & Big Data. Avid SCUBA diver, Open-source developer, HAM radio operator, astrophotographer, and anything nerdy.
Born and raised in Philadelphia, PA, USA, currently living in Utrecht, Netherlands, USA, and Thailand. Was also living in Israel, but left.
Pronouns: Sir / Mister
(Above pronouns are not intended to mock, i will respect any persons pronouns and only wish pronouns to show respect be used with me as well. These are called neopronouns, see an example of the word "frog" used as a neopronoun here: http://tinyurl.com/44hhej89 )
A proud member of the Penobscot Native American tribe, as well as a Mayflower passenger descendant. I sometimes post about my genealogical history.
My stance on various issues:
Education: Free to PhD, tax paid
Abortion: Protected, tax paid, limited time-frame
Welfare: Yes, no one should starve
UBI: No, use welfare
Racism: is real
Guns: Shall not be infringed
LGBT+/minorities: Support
Pronouns: Will respect
Trump: Moron, evil
Biden: Senile, racist
Police: ACAB
Drugs: Fully legal, no prescriptions needed
GPG/PGP Fingerprint: 8B23 64CD 2403 6DCB 7531 01D0 052D DA8E 0506 CBCE
Joined Jul 2018
